As discussed in the previous post, low-income and most low-middle-income countries play almost no role in methane emissions. Therefore, embarking on related targets and projects will not make a dent on a global scale. Instead, it might end up increasing foreign debt and diverting from other perhaps more pressing developing gaps, local climate change issues included. Needless to say, these countries have historically contributed little to the current dangerous levels of GHG emissions. Therefore, they should not spend much energy on such a target in my book.
What about the second Glasgow target, coal in the power sector? Here, we have to look at coal first to then poke into the power sector. According to the most recent data, in 2020, coal accounted for 41.3 percent of all CO2 emissions, followed by oil with almost 30 percent and gas with 22 percent. And as we know, coal is the worse polluter among fossil fuels. So Glasgow is right on the money here. But let us take a closer look regionally and by country income levels.
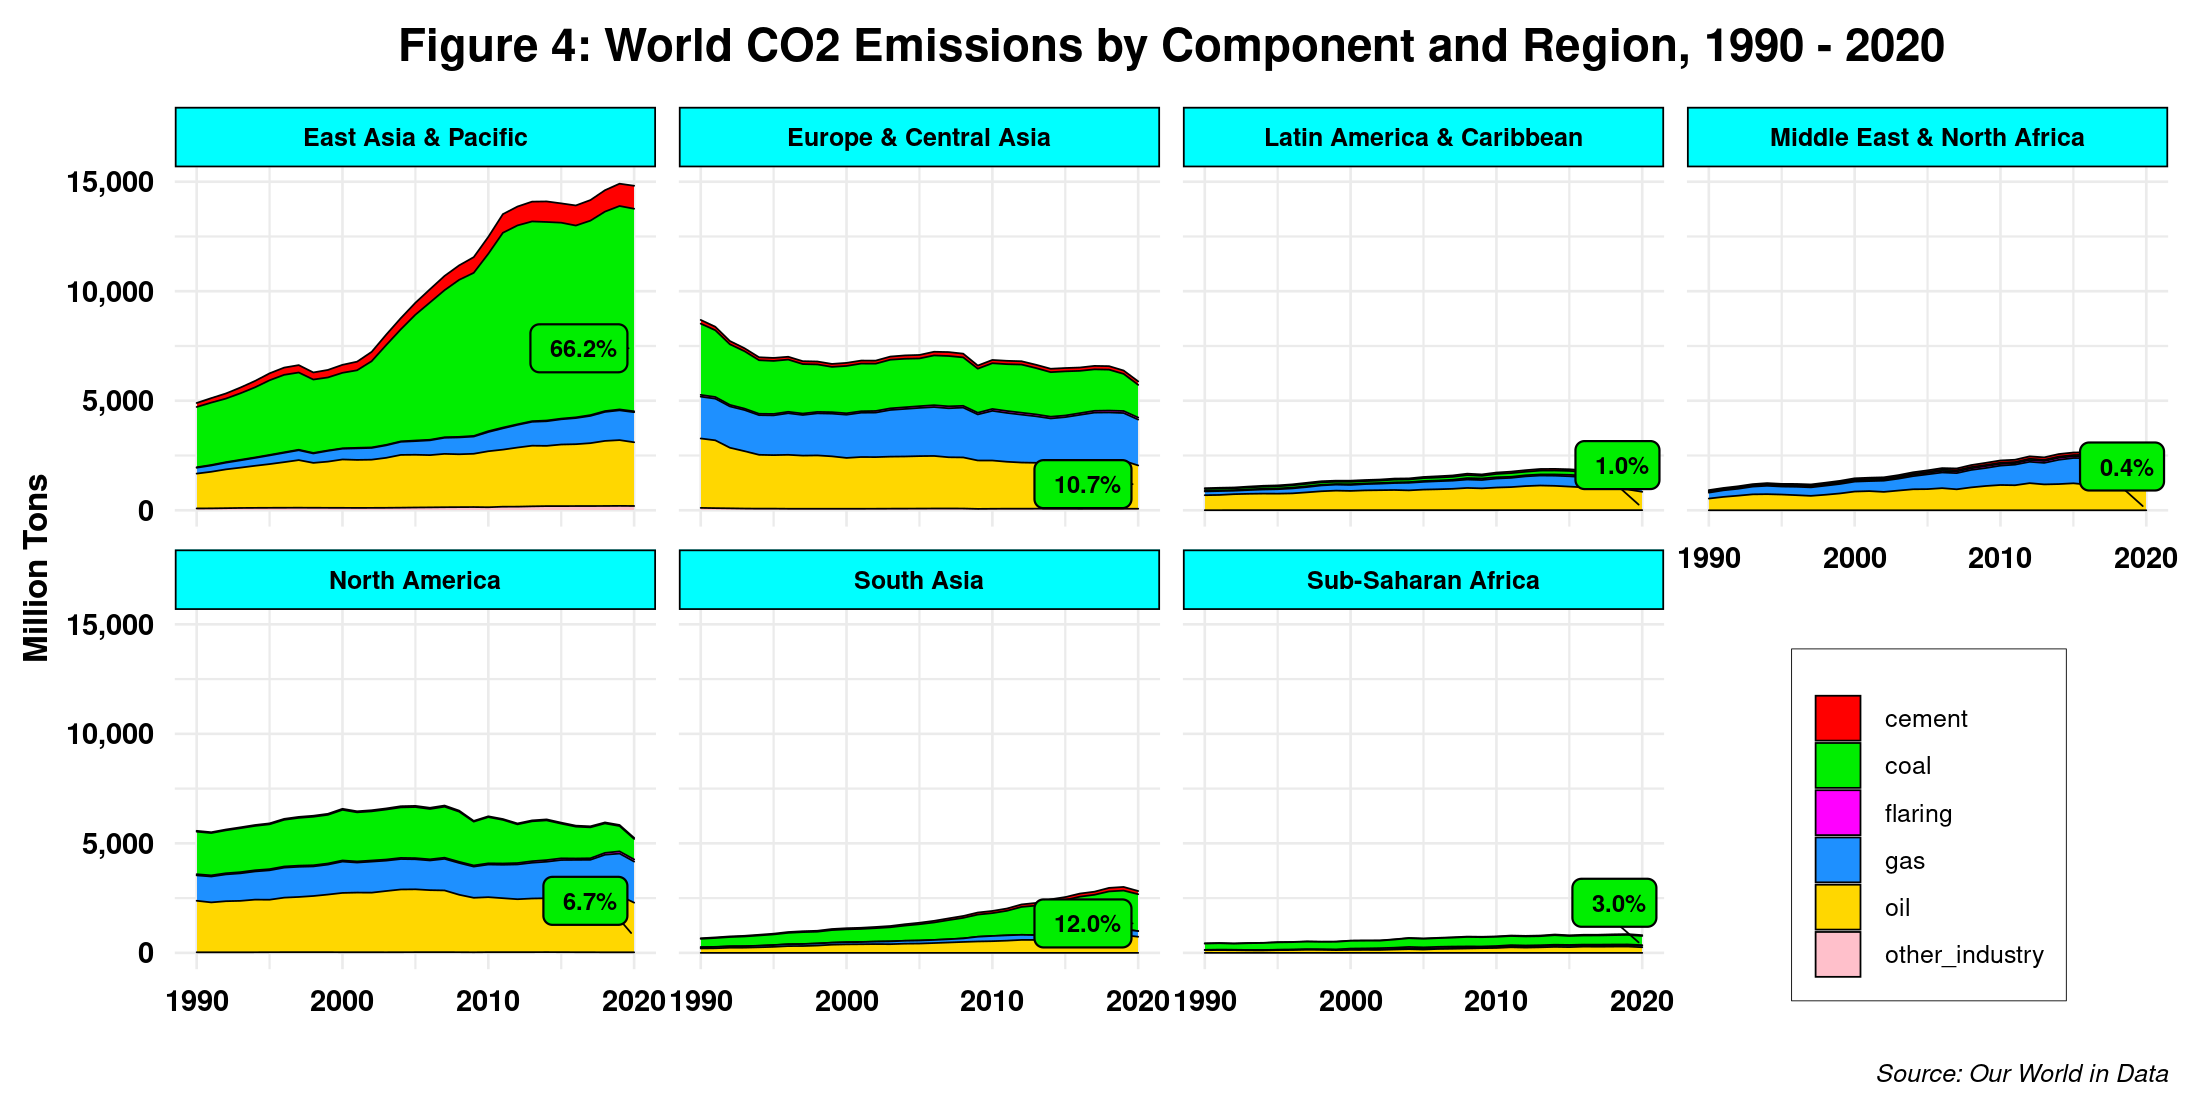
Figure 4 shows CO2 emissions by component and region. The label shows the global share of coal emissions for each region. For example, SSA only emits 3 percent of the total coal CO2.

So while East Asia & Pacific is the undisputable leader, Sub-Saharan Africa plays a marginal role even though South Africa and Mozambique, two of the top ten global coal exporters, are included here. The same goes for LAC, which comprises Colombia, another top ten, and MENA. For the record, Australia is the world leader here, by far. Interestingly, the Glasgow agreement explicitly mentions South Africa as part of a joint initiative to help the country transition to greener pastures. Per capita coal emissions numbers show a slightly different distribution, with East Asia leading, followed by North America (U.S. and Canada) and Europe and Central Asia. The other four regions do not even reach 1 ton of coal emissions per person per year. Note also that these figures are production-based or territorial emissions. So for big coal exporting countries, actual emissions occur in those importing the fossil fuel for power plants and more.
Figure 5 depicts the same scenario by country income levels. And we get similar results. LMICs and LICs together, where 50 percent of the World’s population inhabits, are responsible for 17.8
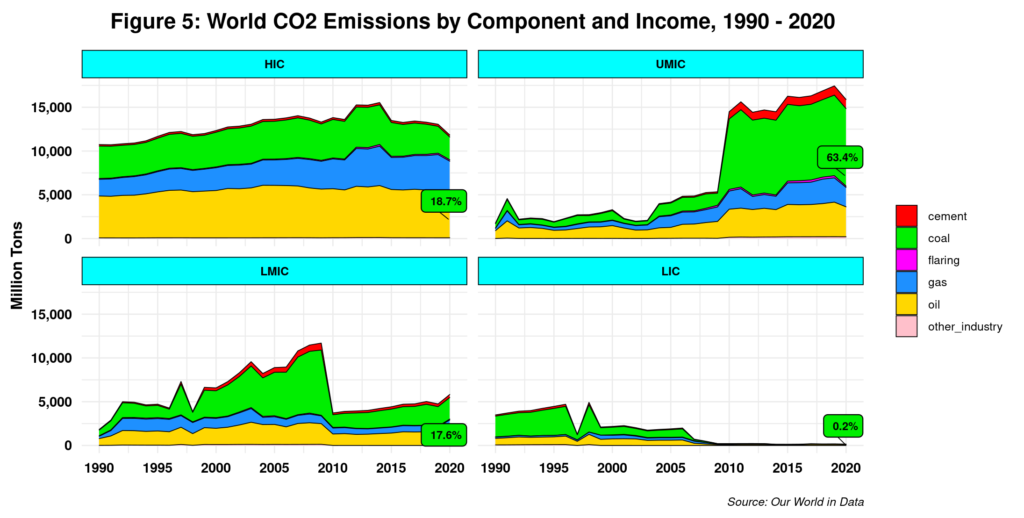
percent of coal emissions. The rest is coming from the upper-income floors. So coal emissions inequality is clearly at work here. Not surprisingly, 3 countries (China, India and U.S.) account for 70% of all coal emissions. So yes, coal is an issue, but it is hardly one that demands the same attention from all countries.
The second part of the Glasgow coal target is sectoral and explicitly focuses on the power sector. CO2 emissions data by sector includes “electricity and heat,” which we can use as an excellent proxy for the former. However, data is only available until 2018. The power sector is the top CO2 emitter at the global level, with a whopping 44.2 percent of the total. Transportation is a distant second with almost 20 percent – recall the EV Glasgow target. So again, Glasgow is on the right track here. But as above, we get a different picture when introducing regional and income level aggregations.
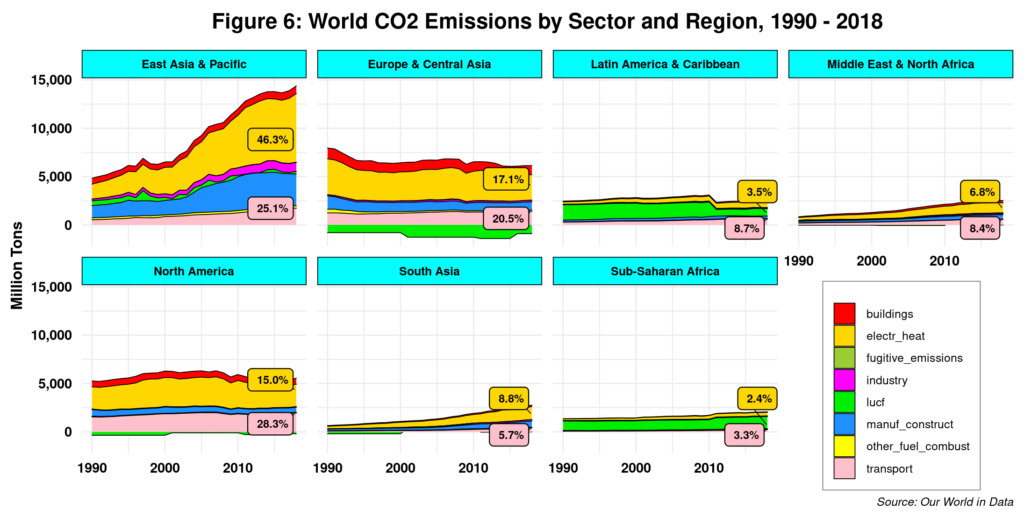
East Asia, Europe and Central Asia, and North America account for almost 80 percent of all power sector emissions. Do the other regions need to focus on energy transition programs and projects? They might indeed have bigger fish to fry. We might as well address Glasgow’s last target endorsing EV adoption. Again, these three regions are responsible for almost 75 percent of transportation-related CO2emissions. On the other hand, SSA is dead last on both. Interestingly, LAC and MENA together contribute to 17 percent of global emissions in that sector, so action on their art might help a bit. But again, this is not a level playing field as four countries (China, U.S., India and Russia) account for 60 percent of all electricity and heat emissions.
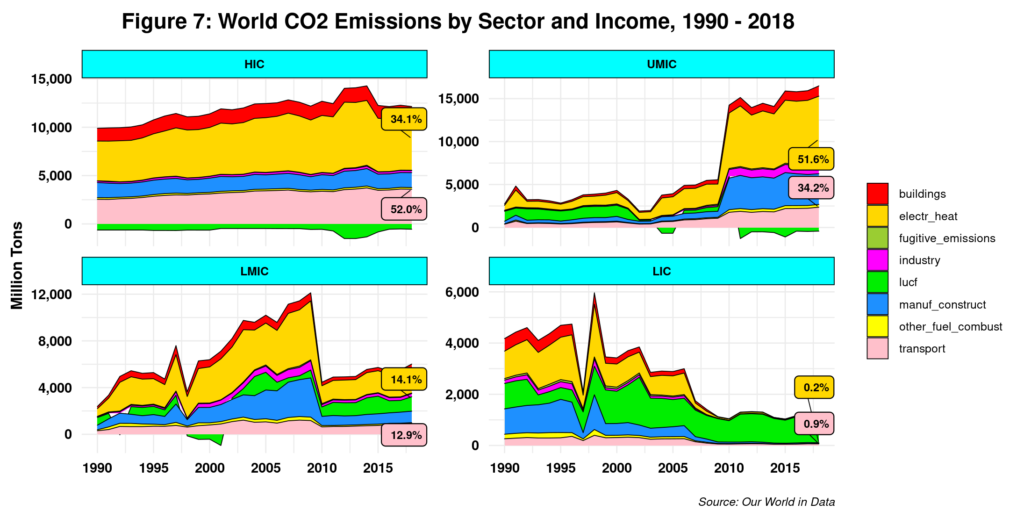
Figure 7 above by country income levels shows similar patterns. Again the two bottom tiers of the global income level edifice contribute less than 15 percent of the world total on both power and transportation, the latter being driven by HIC emissions that comprise more than 50 percent of the total. And again, transportation emissions are not evenly distributed as six countries (US, China, India, Russia, Japan and Canada) emit 50 percent of them. The U.S. alone is responsible for 25 percent of all transport emissions. Do we need to move to EVs in poorer countries as soon as possible?
What about the target on deforestation and land degradation? Data for GHG emissions by sector is also available and include a sector named land use change and deforestation (LUCF). Here we find a very different pattern. At the global level, LUCF and agriculture GHG emissions are relatively small compared to the previously-mentioned big ticket items. While agriculture takes ownership of 12 percent of world emissions, LUCF struggles to get to 3 percent. It thus seems Glasgow did not read the memo in this case. Or maybe it got a different memo when compared to the other three targets.
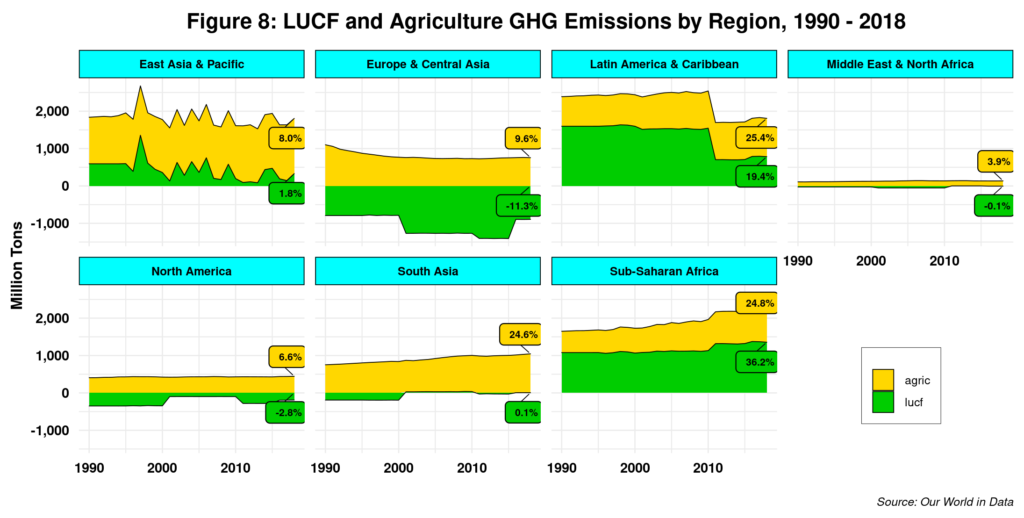
Figure 8 depicts LUCF and agriculture emissions by region. We immediately see striking differences across regions. For example, LUCF emissions for Sub-Saharan Africa represent over 36 percent of the region’s total and, combined with agriculture, account for 61 percent of all GHG regional emissions. LAC seems to have a very similar profile with the caveat that agricultural emissions are more significant than LUCF, but the region is the world leader in total LUCF emissions. On the other hand, Europe and Central Asia, and North America have negative LUCF emissions, which means that reforestation and afforestation are already reducing emissions. The other three regions report relatively small LUCF emissions. So Glasgow seems to have clear directives for some regions.
In terms of income (figure 9), we see that the lower-income countries are LUCF leaders, whereas the top echelons report negative emissions. Moreover, for the former, LUCF and
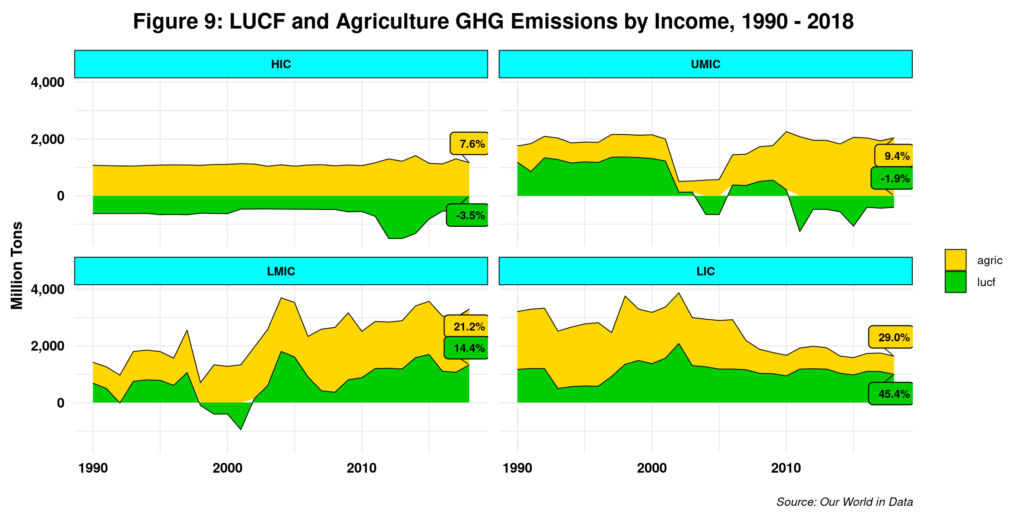
agriculture represents almost 75% of all emissions. Note, however, that countries such as Brazil, Peru, and Colombia are part of the UMIC cohort. At any rate, three countries (Indonesia, DRC and Brazil) contribute 51 percent of all LUCF positive emissions. In any event, the cool thing about this Glasgow target is that it can operate as a natural “CO2 removal technology” without having to invest in unproven or expensive climate technologies. But it needs additional help to achieve the overall goal we are aiming for.
From a developing country perspective – and bearing in mind that such a cohort of countries is far from monolithic, three of the four Glasgow targets seem to be out of sync, especially for the half of the world’s population that live in LMIC and LICs. The target of halting deforestation and preventing land degradation seems the most relevant for them, including some UMICs with similar GHG emission profiles. Nevertheless, developing countries should be fully aware of where they stand regarding global GHG emissions and, on that basis, design green strategies that promote human development and improve the overall quality of life. Their climate agendas should not blindly follow that of most advanced countries, even if we think EVs are cool, for example. Instead, they need to decolonize decarbonization which, for most, is not related to an “energy transition” (see figure 10).
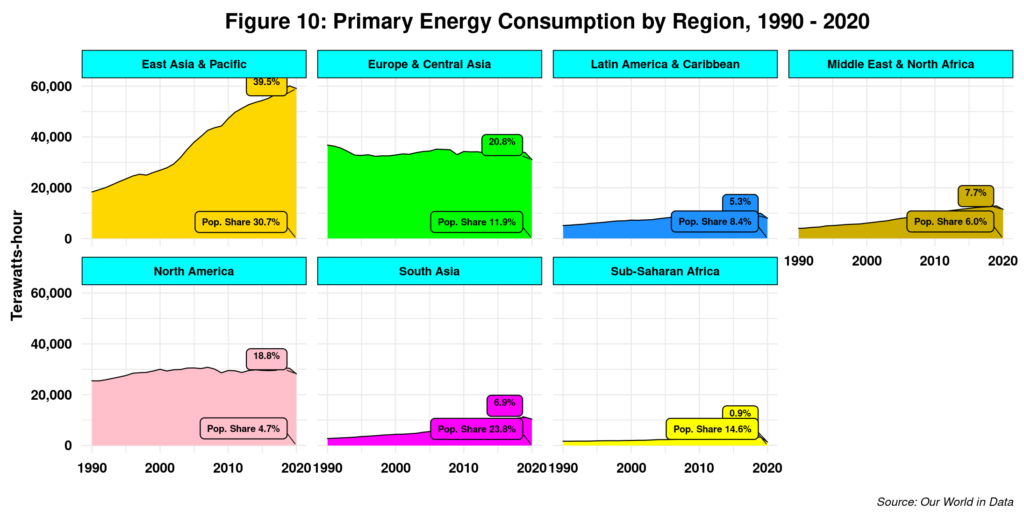
The poorest countries barely use energy, so changing or reducing what one does not have is indeed difficult, if not impossible. They should thus not be told what to do. Instead, they should have the leading voice in global discussions, more so when they have contributed little to the current climate crisis but seem to be paying a higher price. That is a bad deal, by all standards.
Cheers, Raul

Comments
One response to “Net-zero Emissions and Developing Countries – II”