The town where I currently reside is planning to change its e-Waste collection policy starting next year. As it is today, town people can go downtown once a month and drop their old computers, laptops, monitors and the rest. T his will now be reduced to one day per year. Missing that date will entail people having to go to some other place out of town to take care of business. Or one could try to go to a nearby and more affluent village where one can drop the stuff at any time. Probably not kosher, though.
I am not sure if this change is the result of budget cuts or lower demand for such service – or both. I am not really following town decision-making processes. But I do know that e-Waste collection is a state law, and all towns must thus take care of business. Note that appliances such as dishwashers, fridges, and others are not part of the e-Waste mandate. They are in fact covered by other regulations albeit smart appliances are now becoming more commonly used thanks to the so-called IoT revolution which seems to be taking longer than expected to take off for good.
e-Waste has been around for over 15 years now. Its most notorious and nefarious showing was over a decade ago when photos, pictures, and even film documentaries showed how most of the stuff used in the West ended up in developing countries. Back then, China was a leader. We also learned that e-Waste was indeed big business, as most of the electronic stuff dumped has minerals and metals that can be sold for a profit in the global market. And let us not forget that what is e-Waste in industrialized countries actually becomes a second-hand/first-time-user goods in poorer countries.
Unlike data for both Internet and mobile phone access, stats for e-Waste by country are not easy to find. A bunch of UN agencies and development organizations got together last year to address this gap. The first report on e-Waste was also published in the previous year. The report tells us that only 41 countries officially collect e-Waste statistics while data harmonization only exists in Europe. Data for all other countries included in the document was estimated using trade statistics. Unlike my town of residence, e-Waste here includes appliances as well as sizeable electrical equipment and lamps, among others. Let us look at some of the data.
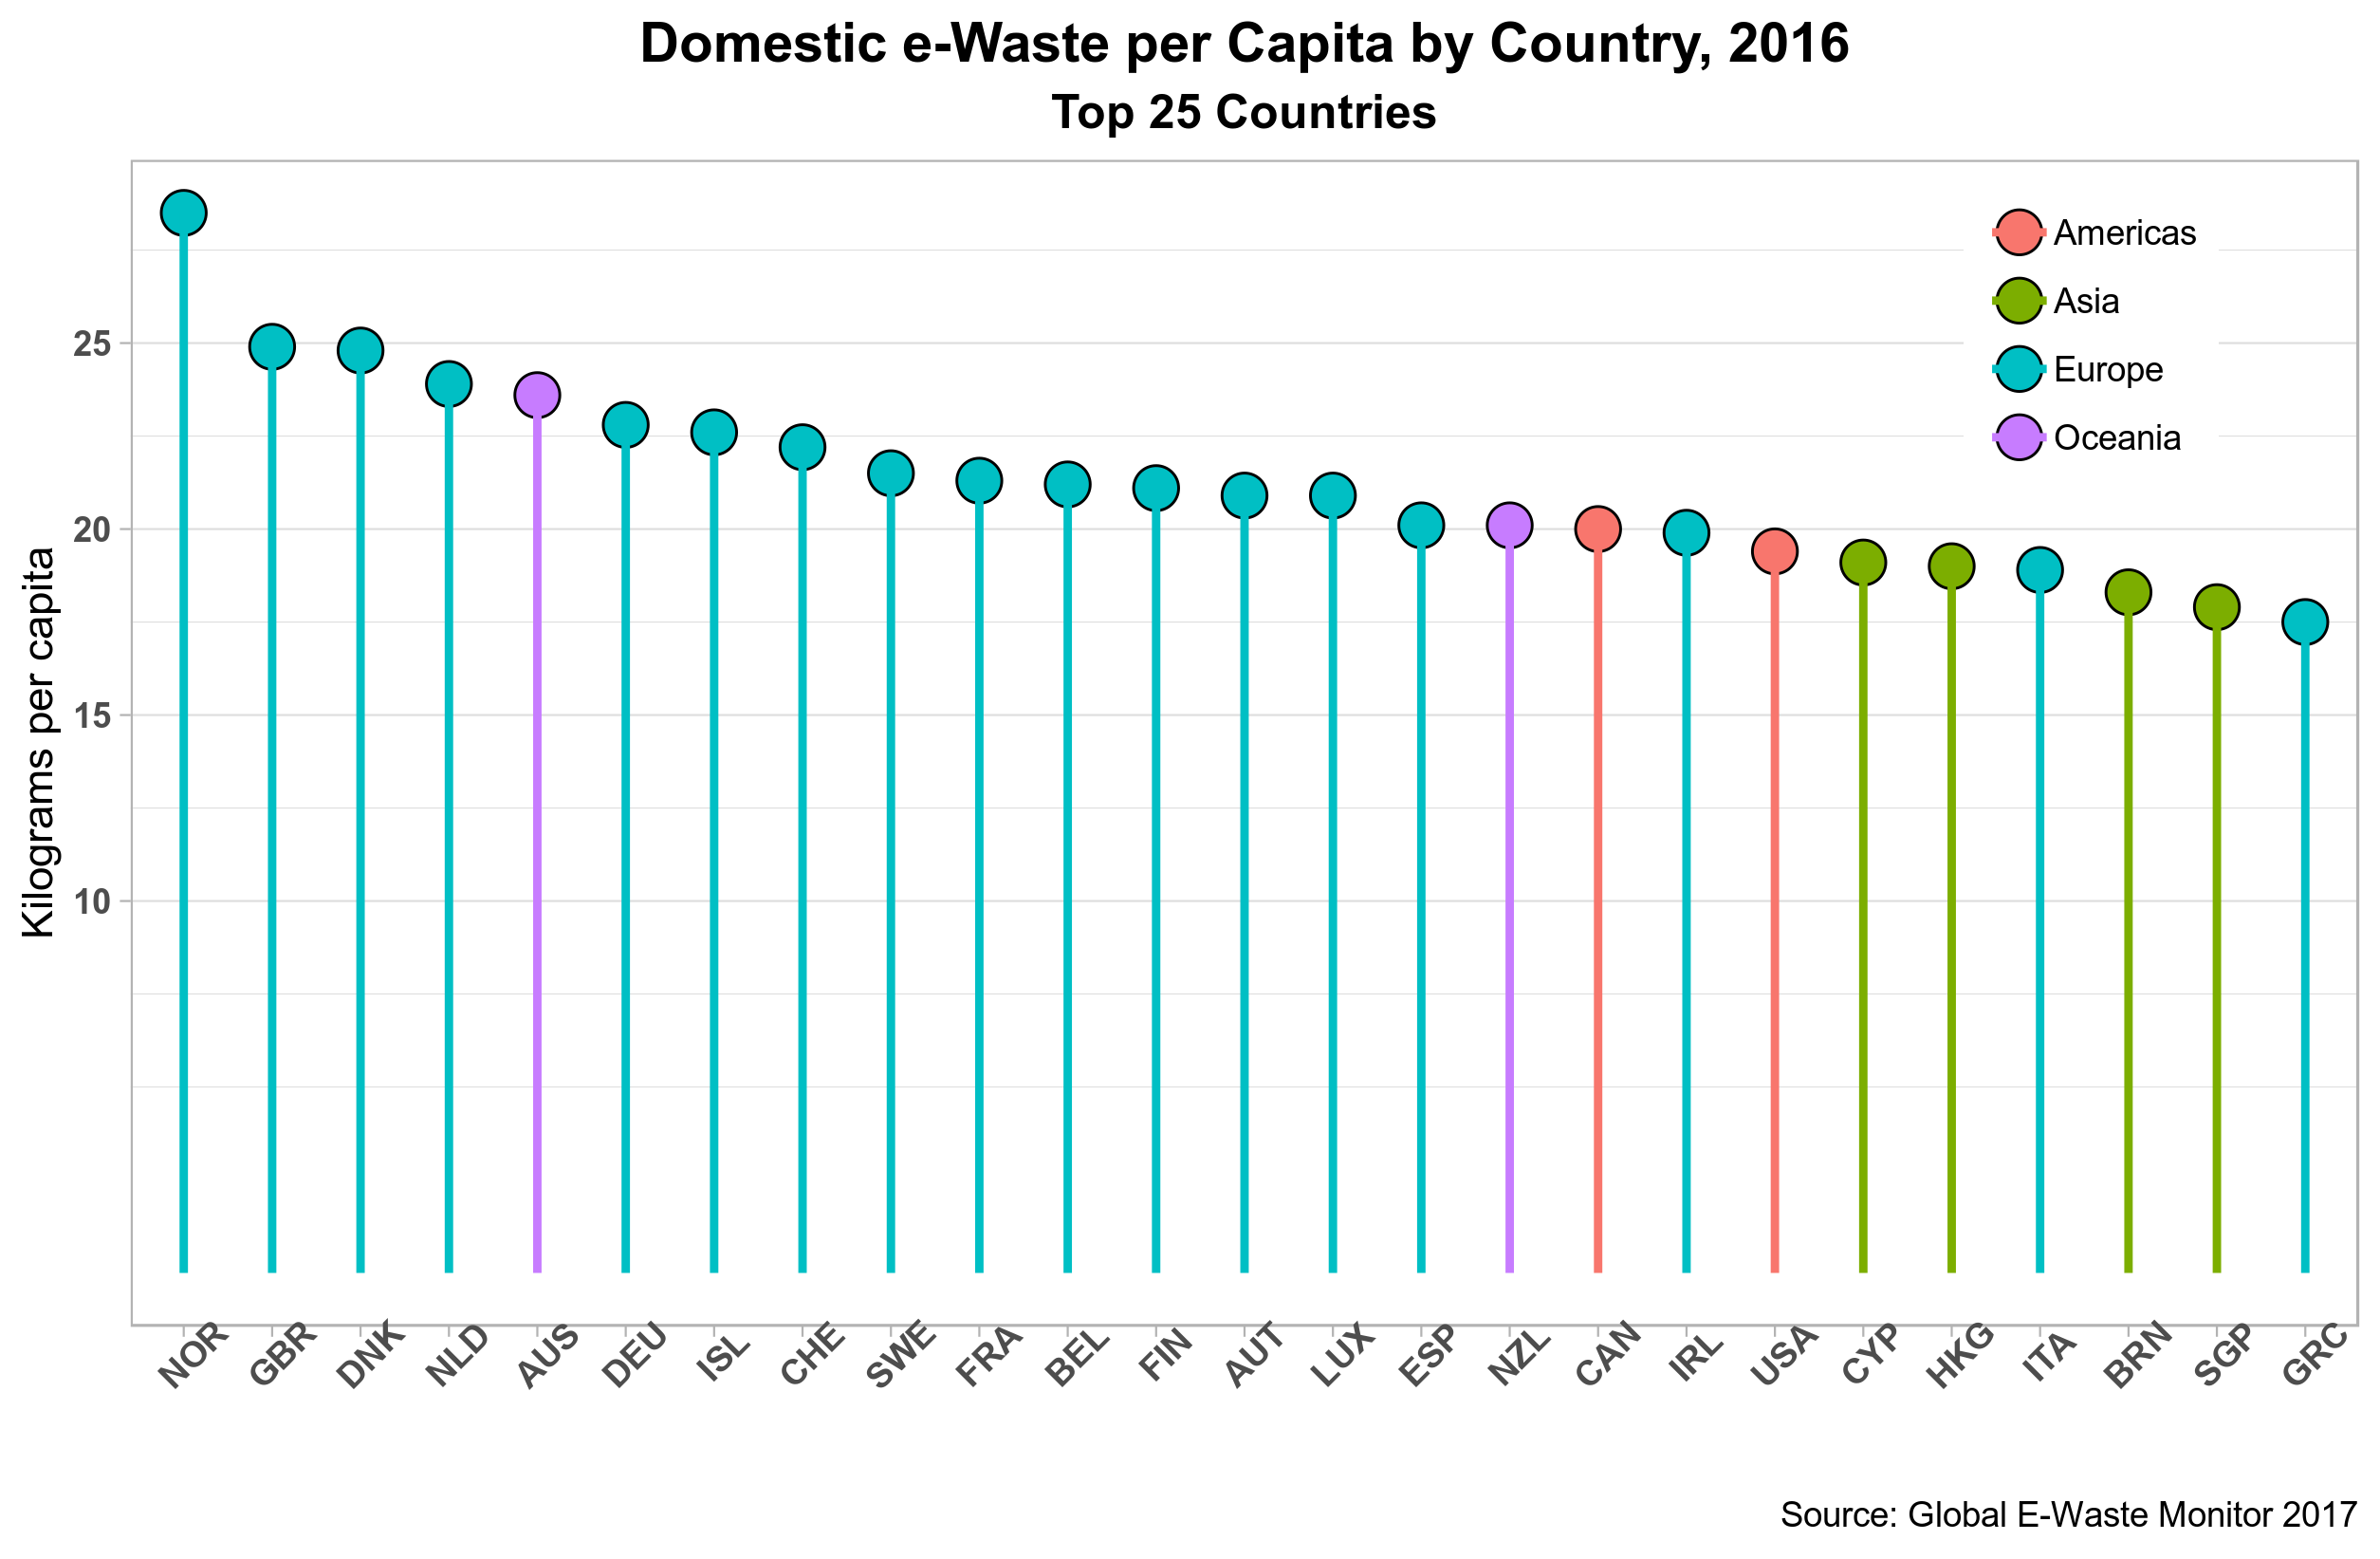
The figure below shows the top 25 countries 1 To convert kilograms to pounds double the number and then add 10 percent. So 25 kgs. are 50+5 = 55 pounds. Converting back to kgs. is however not as simple: divide by two and then divide the result by 1.1 -> 55/2 = 27.5/1.1 = 25
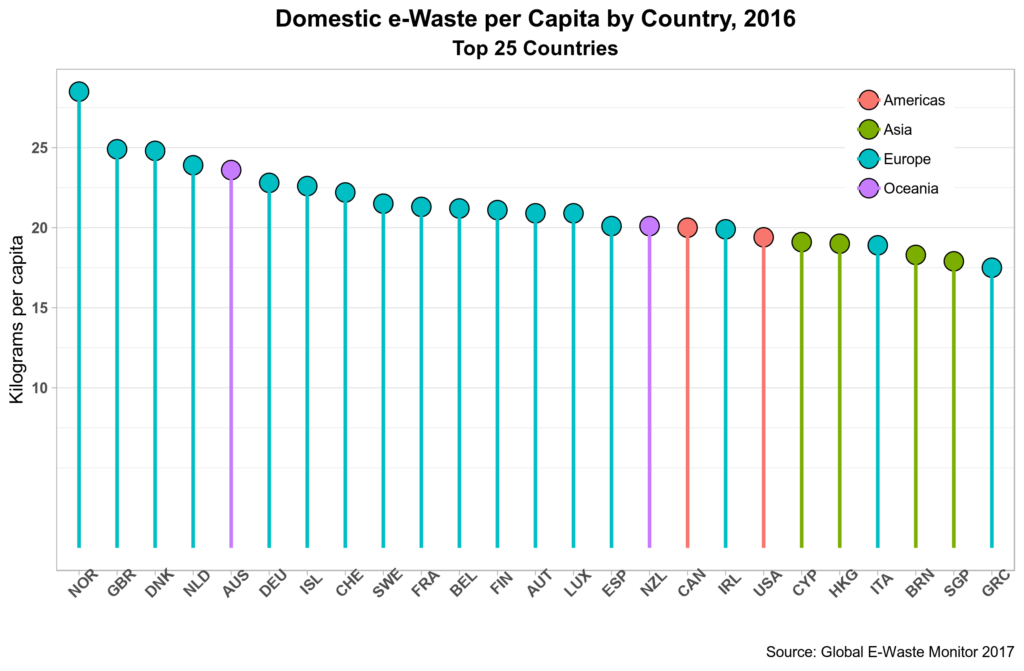
Norway leads by a comfortable margin while the UK and Denmark seem to be on a head-to-head race. Perhaps surprisingly, the US is not even in the top 15 and countries such as Austria and Spain are ahead, just barely. No African countries make this list while China absence is indeed conspicuous. The top 25 countries are all high-income countries, so a positive correlation between development level and e-Waste clearly exists. But these rankings are more similar to those of the UNDP Human Development Index (HDI). Data do show a higher correlation with the HDI which, it goes without saying, does not include any environmental data in its calculation.
The next figure shows the relation between total national and per capita e-Watse for countries generating more than 100 kilotons by income levels as defined by the World Bank. Bubble size is a proxy for total country population.
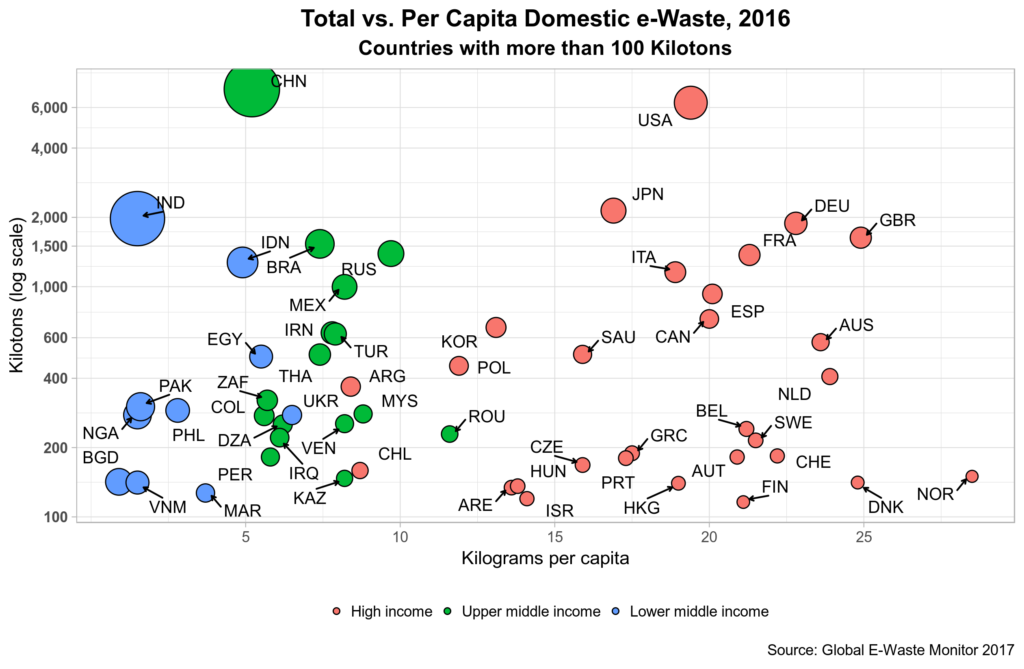
We first note that no low-income countries make the cut. Second, there is a clear pattern between income level and per capita e-Waste which corroborates out finding from the previous chart and data. Furthermore, when it comes to total domestic e-Waste generated, China, the US, India, and Japan are clearly on the lead, bearing in mind that China has four times the population of the US and more than 10 times than that of Japan. Population size alone is thus not a good proxy for e-Waste generation. But in any case, less than 50 countries have already passed e-Waste related legislation.
The e-Waste report also reveals that 93% of all US e-Waste goes to Asia. So now I know that the old laptop I left at the e-Waste center in 2016 had a 93% chance of ending up somewhere in Asia. Wonder if we could track these flows in more detail.
Blockchains for e-Waste anyone?
Cheers, Raúl

Endnotes
| ⇧1 | To convert kilograms to pounds double the number and then add 10 percent. So 25 kgs. are 50+5 = 55 pounds. Converting back to kgs. is however not as simple: divide by two and then divide the result by 1.1 -> 55/2 = 27.5/1.1 = 25 |
|---|