In 1988, the Brussels-based Centre for Research on the Epidemiology of Disasters (CRED) launched the Emergency Events Database (EM-DAT) with the idea of promoting national and international humanitarian support to countries and regions affected by such events. Having a structured set of global data on the subject can also help policy and decisionmakers develop more comprehensive preparedness plans, properly assess vulnerabilities and facilitate on the ground interventions based on previous experiences.
Disaster data included in EM-DAT must fulfill at least one of the following conditions. 1. 10 or more people dead. 2. 100 or more people affected. 3. A declaration of a state of emergency. And 4. A call for international assistance. Data coverage starts in 1900 and covers 230 countries and territories. Data is updated regularly. The data set I downloaded a couple of days ago included 24,270 events.
EM-DAT classifies disasters under three categories. 1. Complex disaster. 2 Technological disasters. And 3. Natural disasters, the latter comprising 63.3 percent of all events. Figure 1 below presents the evolution of the various types of natural disasters since 1900. To simplify a bit,
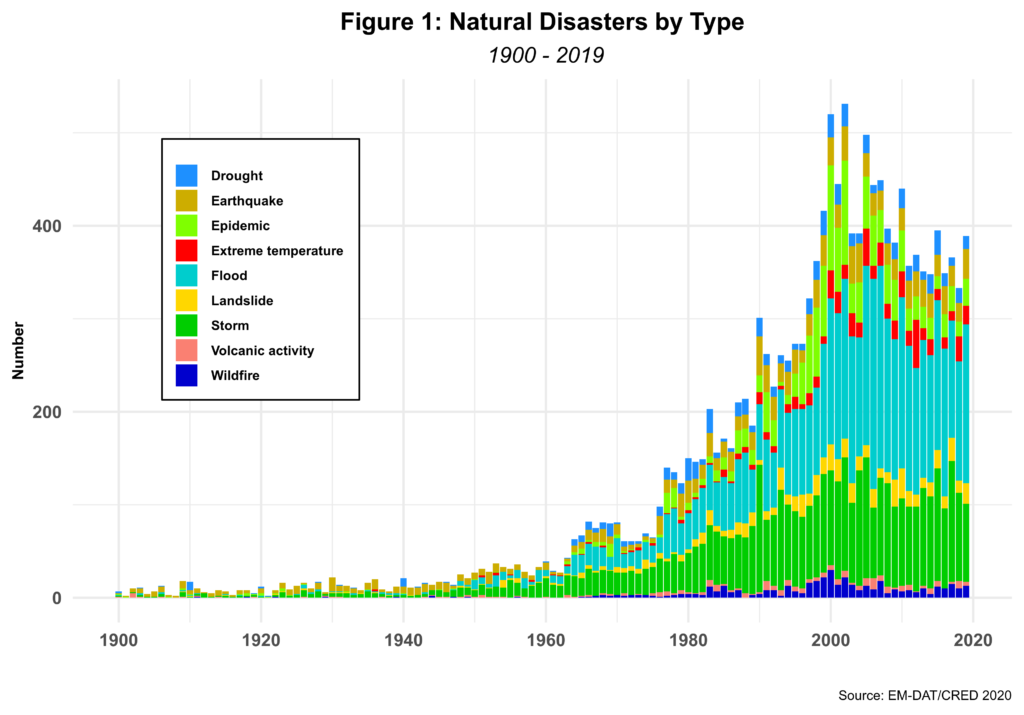 I have excluded disaster types with less than 100 occurrences in the 120 years covered by the data.
The number of disasters takes off in the mid-1960s, reaching a peak in 2002. They have declined somewhat since but seem to be making a comeback in the last few years. For the pre-1960s years, two factors should be mentioned. One is historical data collection that back then was perhaps much more complex and cumbersome than today. That implies that most probably underreporting could be an issue. Second, the end on colonialism and the emergence of new nation-states in the developing world in the 60s must also make a difference. Here, more nation-states are reporting data since that time.
Floods account for 33.7 percent of natural disasters closely followed by storms that report a 27.9 percent share. Needless to say, the two are closely related. Earthquakes (including tsunamis) and epidemics are next but fail to reach the 10 percent threshold. All other natural disaster types report shares of less than five percent. From the chart, we can also tell that floods and storms have notably increased since the 1960s. Nevertheless, the data shows that droughts and earthquakes are the most lethal, followed by storms and floods. Financial damage estimates, however, put storms and floods back on top.
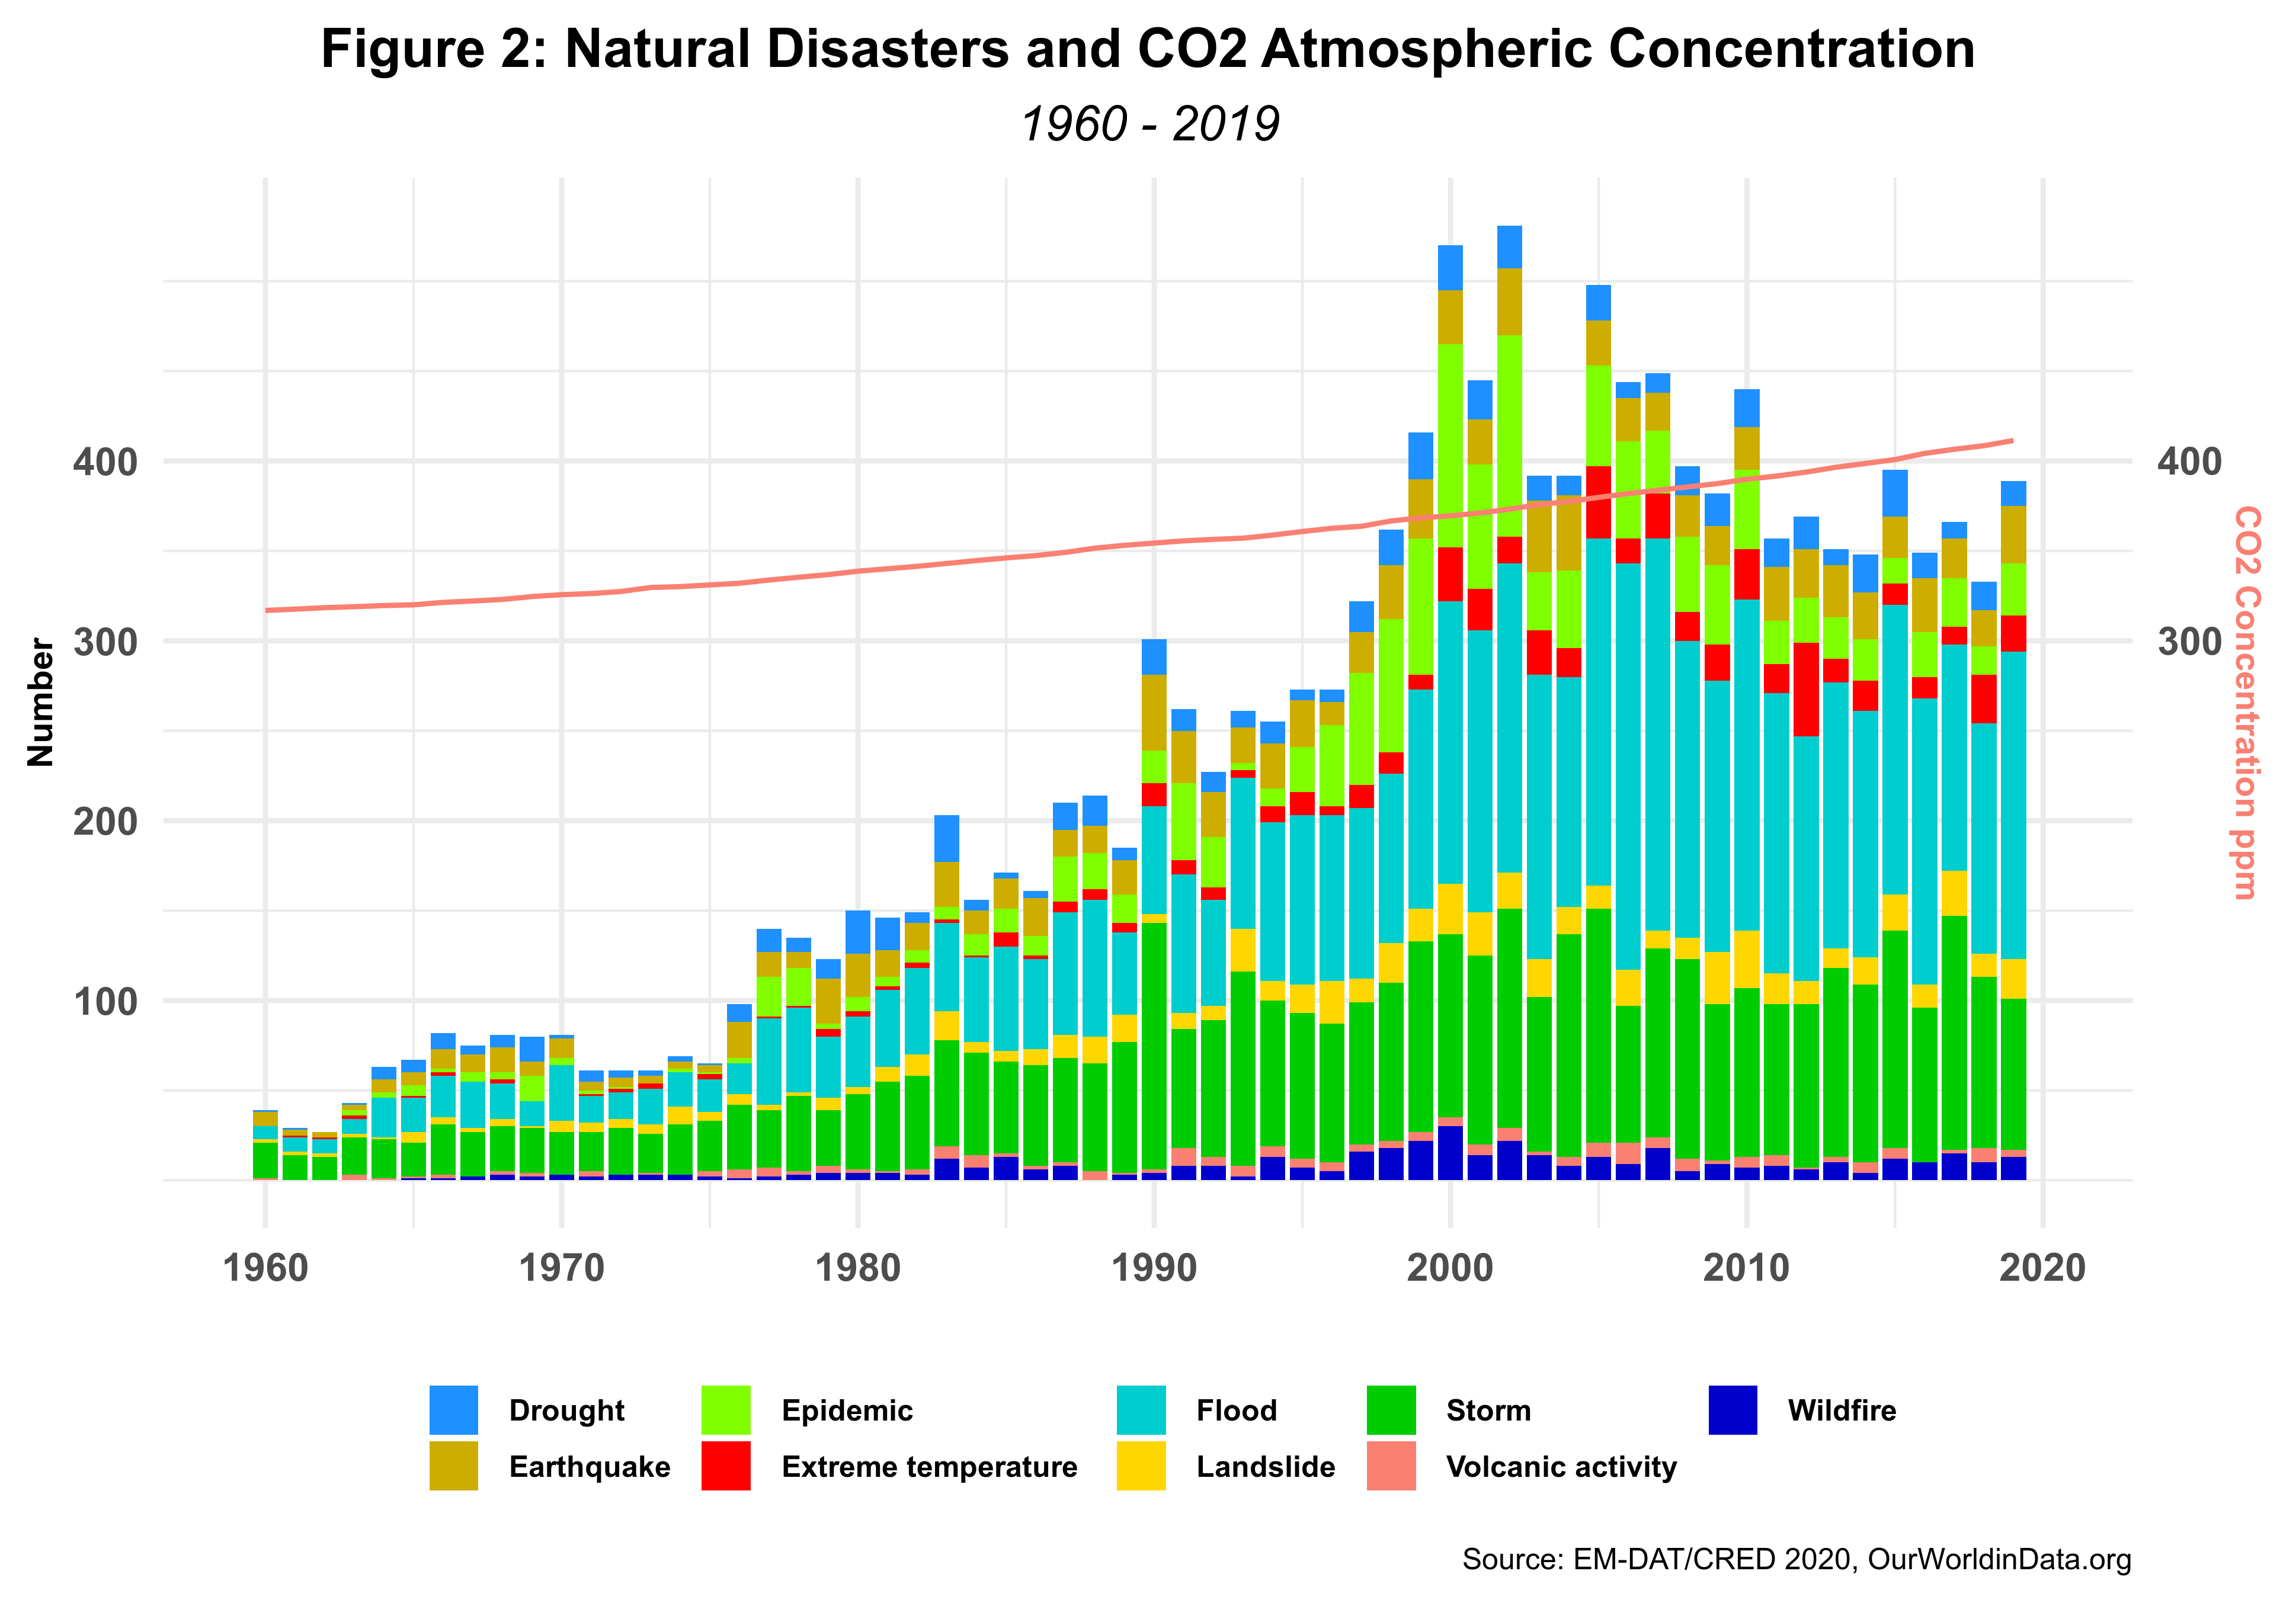
The 1960s are also the host to the now well-known acceleration of CO2 atmospheric concentration. Figure 2 graphs the relationship between natural disasters and CO2 concentration, starting in 1950 and includes all natural disaster types.
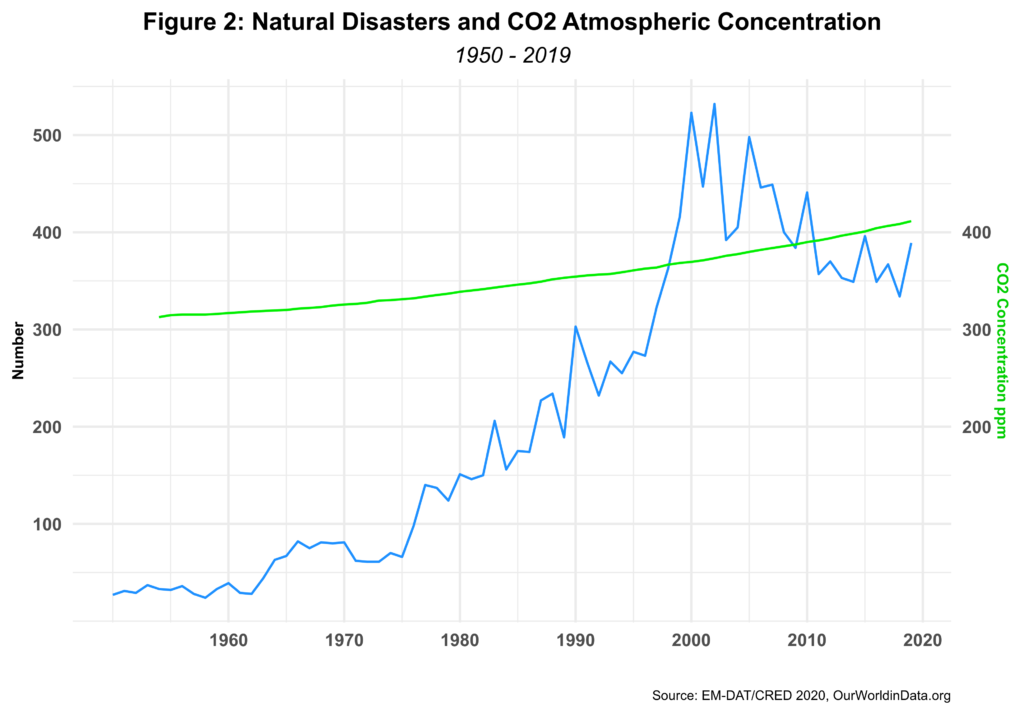 The correlation between natural disasters and Co2 concentration is astounding and corroborated statistically by a 0.94 correlation coefficient. Note, however, that while the changes in Co2 concentration are mostly linear, the growth in the number of natural disasters is almost exponential, at least until 2005. Unlike the constant upswing of Co2 evolution, natural disasters wiggle and seem very sensitive to economic booms and crises. From the chart, one can quickly identify the early 1970s “oil crisis,” the 1982 and 1987 economic recessions, the long economic boom of the mid-90s, the 2000 dot-com crash, the 2002 recession and the global financial crisis of 2006/07. Carbon concentration in the atmosphere, however, seems to be more immune to economic volatility as it grows slowly but surely. The chart suggests a nonlinear relation between disasters and carbon concentration mediated by changes in global GDP levels.
The impact of C02 atmospheric concentration ignores all borders, physical and socio-political. It thus has a global impact. Disaster events are reported by country. For the period 1950 – 2019, 27% of all natural disasters recorded occurred in six nations with the US leading, followed by China, India, the Philippines, Indonesia and Bangladesh. Disaster reporting once again comes back to the forefront.
Nevertheless, note that Asia seems more prone to such events. Is this so? Figure 3 depicts the share of natural disasters by core regions.
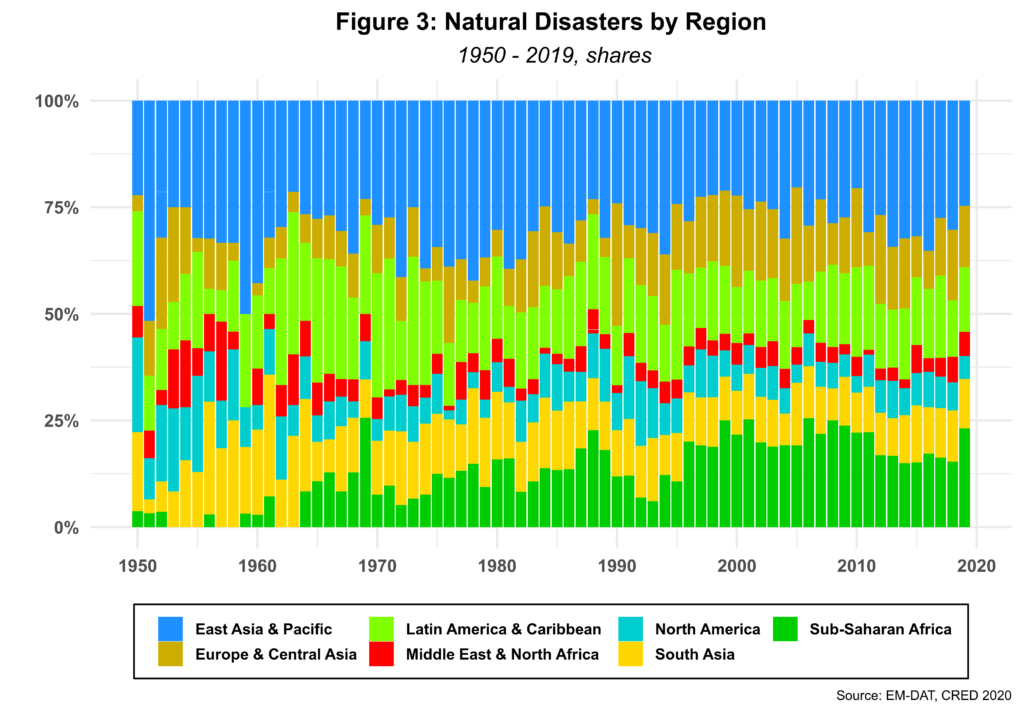 While Asia certainly has its fair share, the trend in relative terms is decreasing as other regions such as sub-Saharan Africa have gained substantial ground in the period under consideration. Bear in mind that since 1960, natural disasters have increased 10-fold on average, so one can conclude that disasters do not have a preferred region. Nowadays, there are taking place around the globe, regardless of geography. What might be different across regions is their intensity in terms of well-known recurrent events such as typhoons, tropical storms, tsunamis and earthquakes, to name a few. For sure, weather-related natural disasters are more a function of latitude and longitude than of nationality, especially if we factor in the potential impact of a continuous long-term increase in CO2 atmospheric concentration.
Figure 4 further explores the relationship between increased natural disasters and caron concentration from 1960 until the end of 2019.
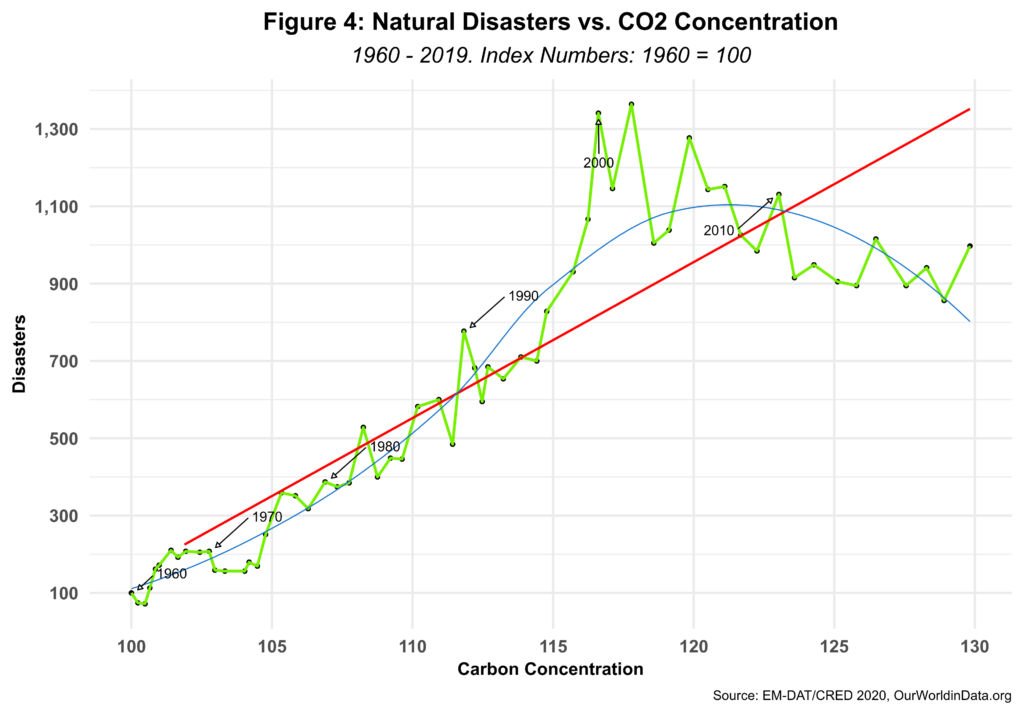 The graph uses Index numbers for each variable computed by using 1960 as a base. Back then, only 39 natural disasters were reported, while CO2 concentration had an annual average of 316.91 ppm. Using index numbers allows us to quickly calculate the rate of change of each parameter. In the period, CO2 increased close to 30% while the number of natural disasters grew ten-fold, as already mentioned, down from a maximum of 1,364 percent in 2002. The blue line fits a polynomial trend line to the data, which seems to have, for the time being, a sigmoid behavior for the most part.
The red line is computed using a log-linear (Poisson) regression model with a time lag of five years for the independent variable, CO2. This simple model assumes that past weather events have no incidence on future ones. The model, significant at the 99% level, shows that a one percent gain in CO2 could generate a 9 percent increase in the number of disasters. However, as briefly mentioned before, natural disasters are also linked to economic activity as they seem to be sensitive to the latter. More research is thus needed.
The current SARS2-VOV pandemic, which might become a data outlier, will undoubtedly introduce more complexity in generating such models.
Cheers, Raúl
