Recent events seem to suggest the cryptocurrency bubble is finally starting to deflate. Bitcoin, Ethereum and most of their crypto cousins are significantly down while regulators  in several countries are finally beginning to take action on the ground. Nobel laureate economists are also speaking up against the digital currency, arguing that the new currency cannot fulfill the three core functions that define money.
Does this mean that ICOs are on the way out?
If we look at the latest ICO data,1 Data was obtained from tokendata.io. The sample size includes 1032 ICOs completed by the end of 31 January 2018. 485 or 47% percent did not report any funding. The total number of successful ICOs is thus 547. The DAO ICO is omitted as it is considered a failure. Hdac, quoted by some as the top ICO, is included but apparently reported at current (lower) Bitcoin prices. the answer seems to be negative.
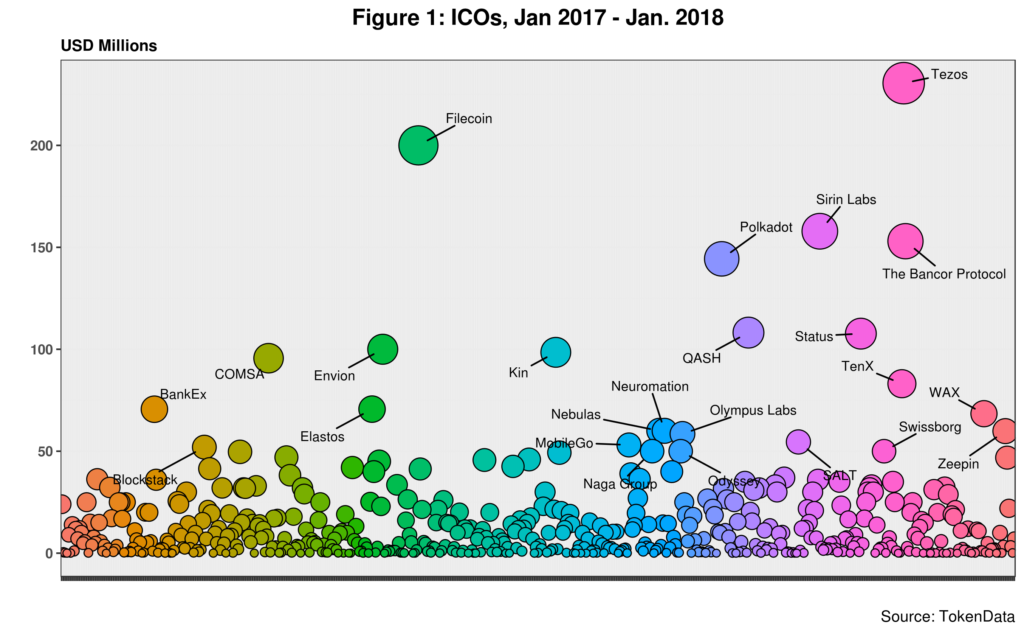 Figure 1 shows 513 ICOs finalized in the last thirteen months. That is almost two ICOs per working day. The graph also highlights the twenty-four ICOs that raised 50 million USD or more. This group of firms attracted 2.24 billion dollars or 32.5 percent of the total for the period. ICOs completed in this same period account for 98.6 percent of all total investment in the sector. This shows that ICOs really took off last year.
Tezos is still the largest ICO, but both the ongoing EOS and the upcoming Telegram ICO could surpass it. On the other hand, note that most ICOs are agglomerated around the investment scale’s low end.
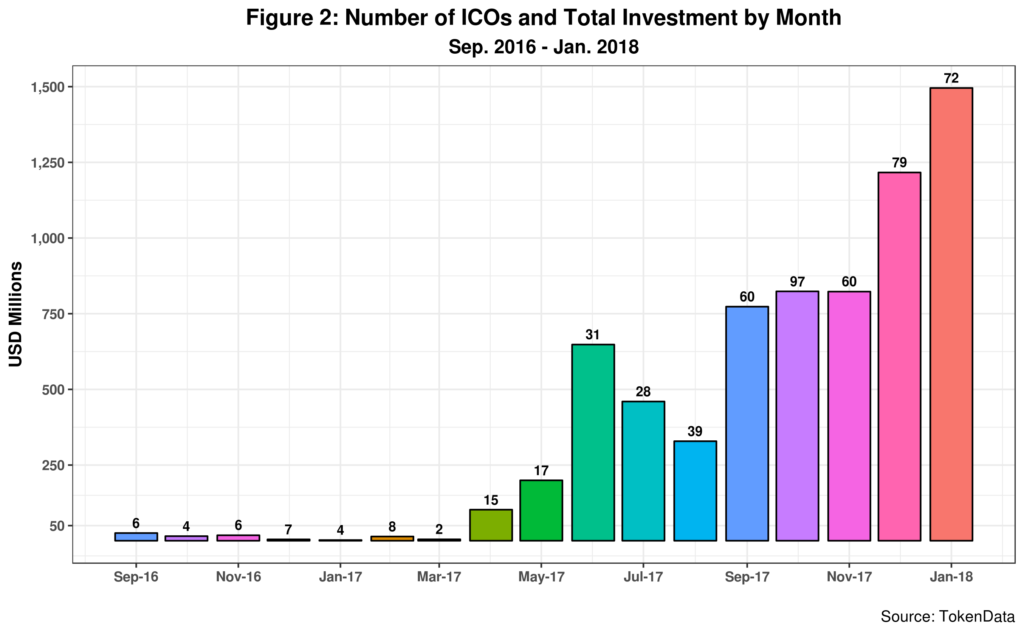
As seen in figure 2, the ICO spike started in April of last year. Total investment by month has been steadily increasing since September. While the most substantial number of ICOs took place in November with 97, January of this year is the most successful regarding funds raised with a total of 1.49 billion dollars. The data also reports 440 ICOs completed in 2017 that is indeed larger than the number of IPOs in the US for that same year but less than the almost 500 IPOs launched in 1999 during the peak of the dot-com boom.
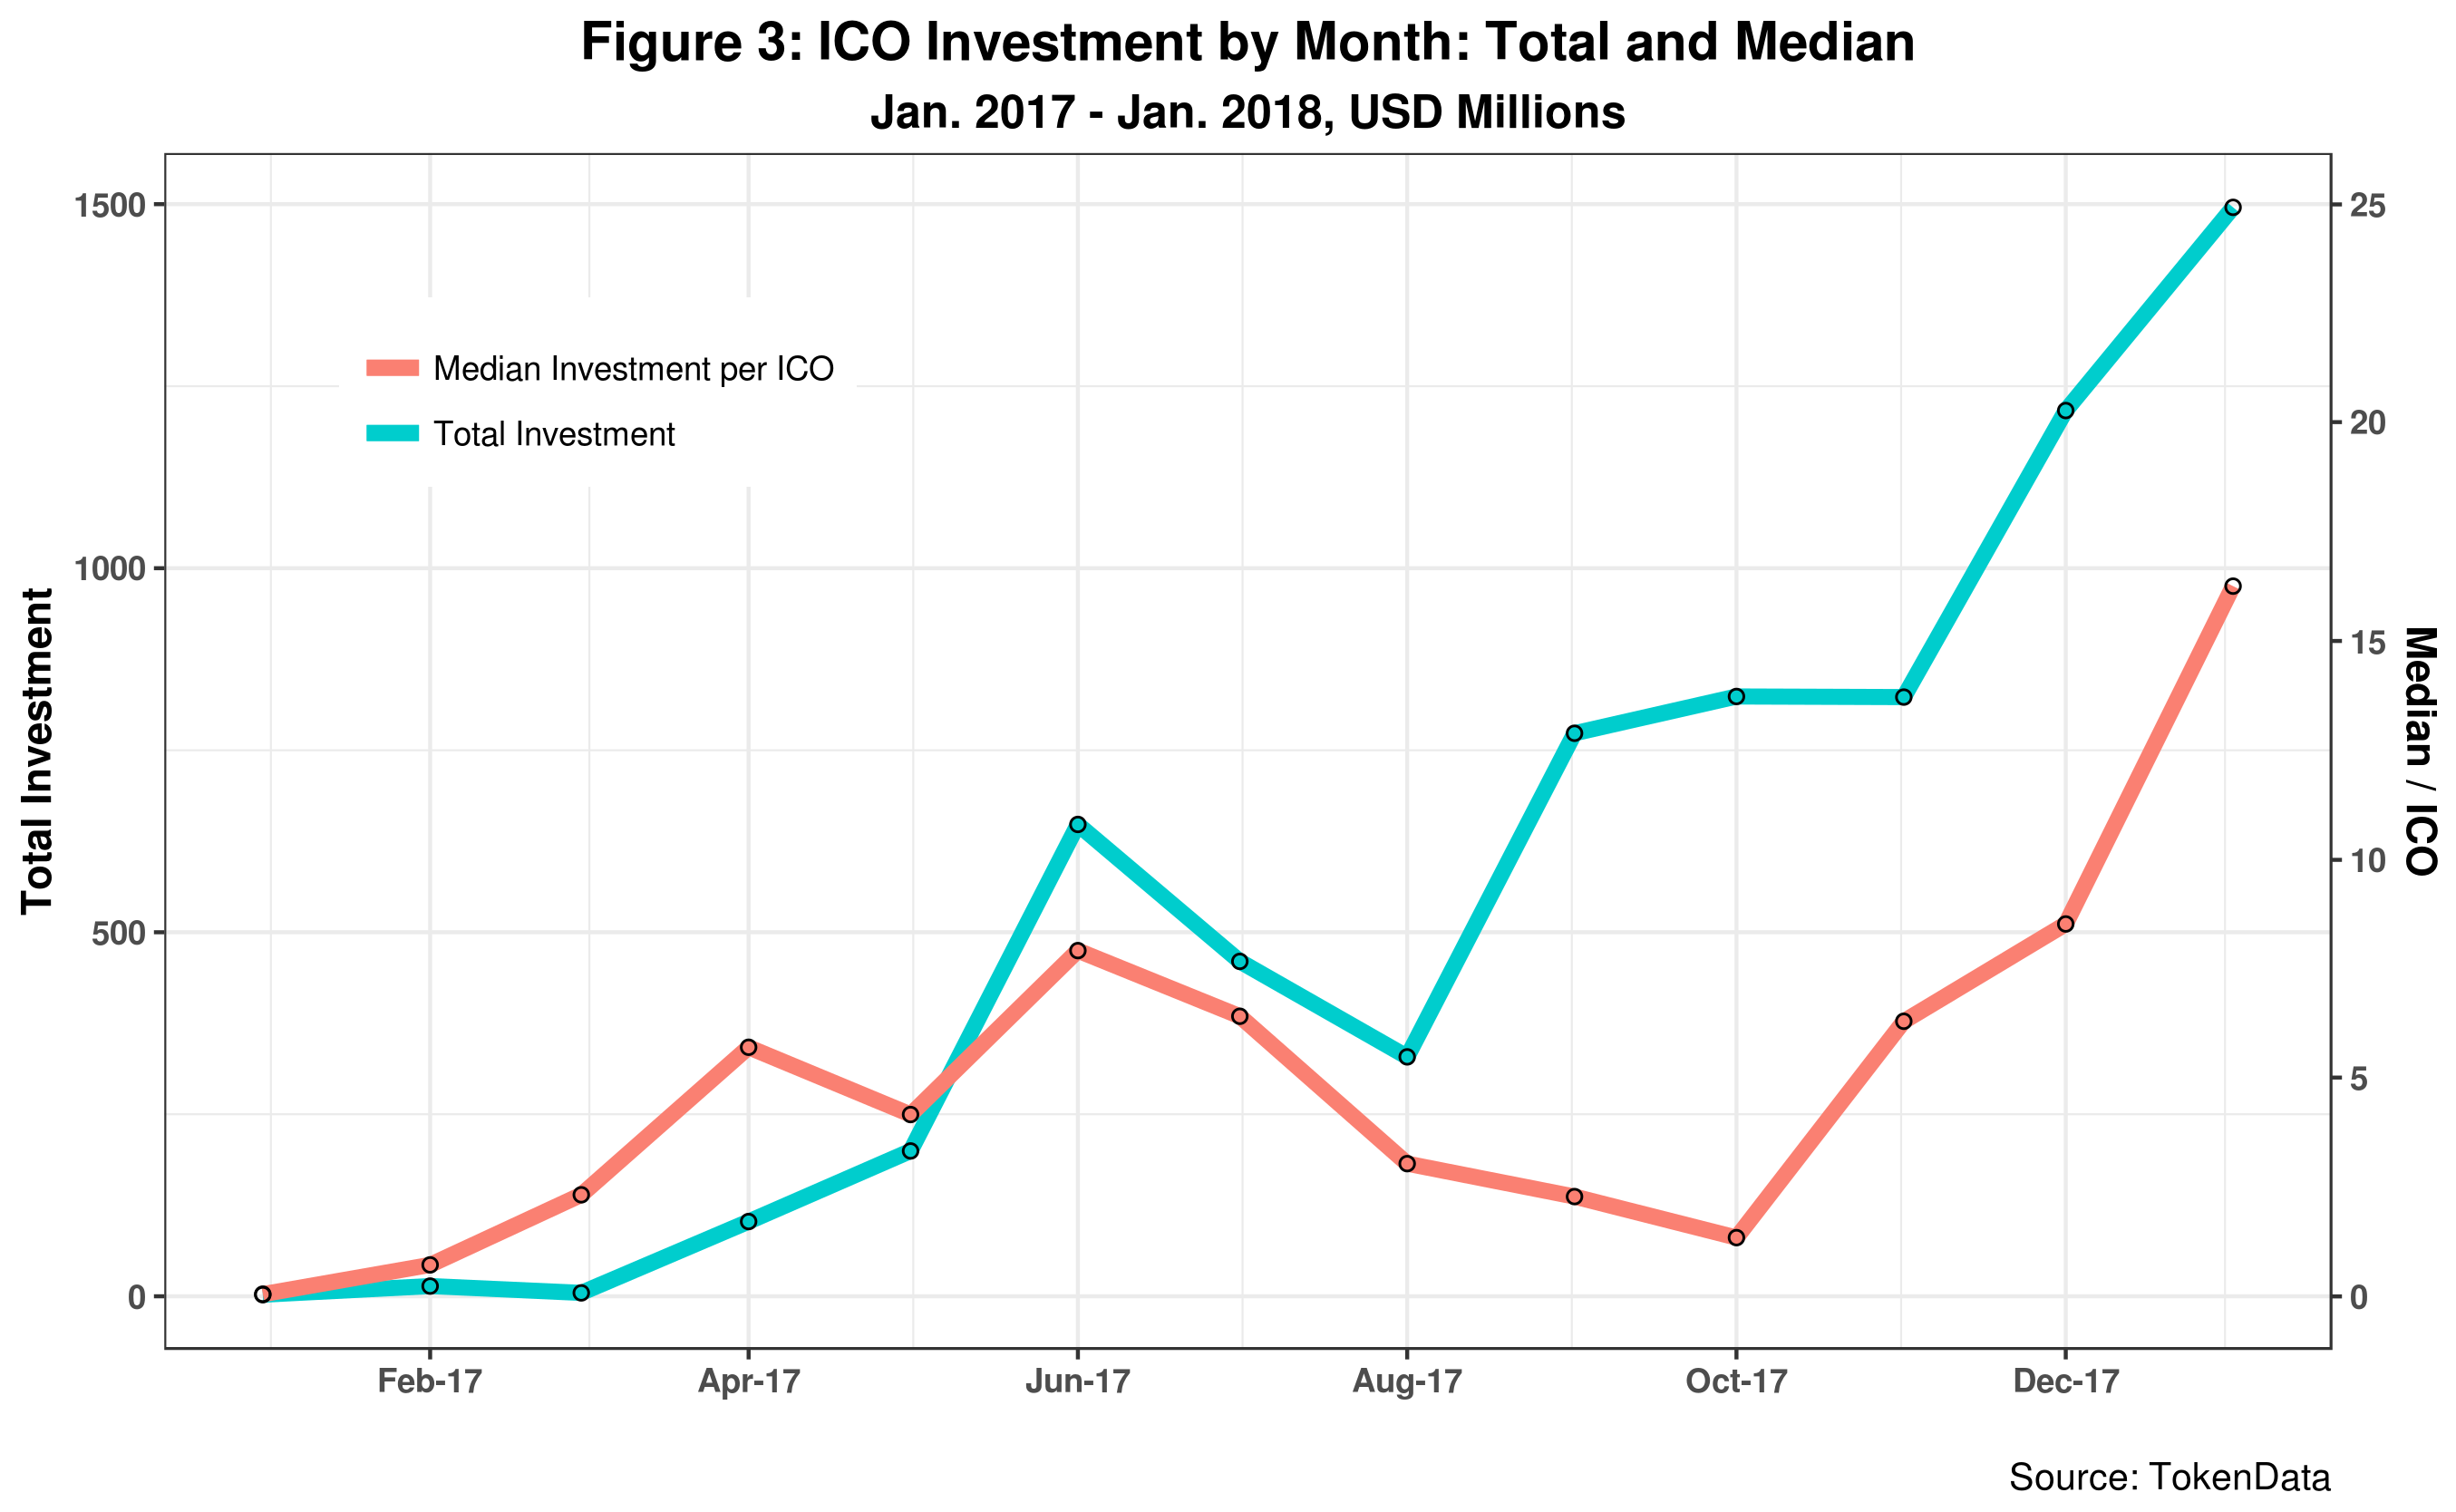
In any event, the data also suggests a steady increase in the median amount each ICO startup or firm is getting. This is depicted in figure 3.

After a slow down during the Summer months of last year, the median investment per ICO has increased since October. At that time, the median per ICO was around 1.34 million dollars. By the end of January, it had risen to 16 million or over twelve times in just four months. This seems to suggest that while more capital is flowing into the sector, the ICO’s quality appears to be improving as a relatively smaller number of startups are getting a more significant amount of funds.
In a previous post, I examined the distribution of ICO investments and noted a high skewness degree. That is, the gap between ICOs getting maximum and minimum capital inflows is very large. This continues to be the case now as, for example, last January, the difference between the top and bottom-ranked ICOs was 99 million USD – the top getting 100 million. My calculations indicate that standard deviations for months with more than fifteen ICOs or more are pretty significant. Skewness is so acute that many sample months have a standard deviation larger than both the mean and the median. However, estimations for the last six months indicate skewness is getting smaller – but not at a rapid pace.
This ICO trait is better shown in Figure 4, displaying the Lawrence curve for all ICOs included in the TokenData sample.
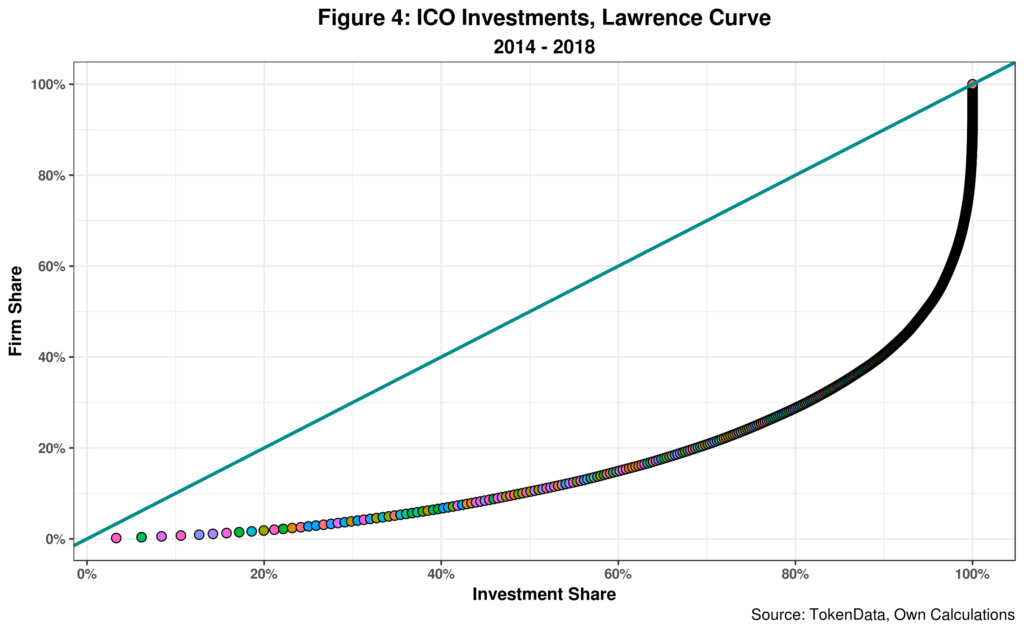
Ten percent of all ICOs attract fifty-five percent of the total of 6.99 billion dollars invested on blockchain ICOs since 2014. Moving up the curve, we note that twenty-five percent of firms in the fray capture seventy-six percent of total investment. That is, 411 companies and startups compete for a pot of 1.68 billion dollars. The median investment for this group is 2.3 million dollars. Not that these amounts are insignificant. But they do show fierce and intense competition in the sector.
More significant here is that close to fifty percent of all ICOs do not report any incoming funding. While some might be keeping this information out of the public sphere, most are probably not succeeding in raising any financing. Since November of last year, the data indicate that the number of “failed” ICOs is more significant than those that prevailed. Last December, sixty-three percent of ICOs did not report any data. This ratio went down to fifty-six percent in January of this year.
All in all, current evidence suggests ICOs are alive and kicking and will continue to thrive in the short run. Intense competition in the sector is also a good proxy for this. While launching and running ICOs might seem simple to some, there are still lots of risks both technologists and investors need to factor in.
The issue now is that financial needs and not technological innovation lead the process with blockchains providing a magic magnet attracting capital from all sides.
Cheers, Raúl

Endnotes
| ⇧1 | Data was obtained from tokendata.io. The sample size includes 1032 ICOs completed by the end of 31 January 2018. 485 or 47% percent did not report any funding. The total number of successful ICOs is thus 547. The DAO ICO is omitted as it is considered a failure. Hdac, quoted by some as the top ICO, is included but apparently reported at current (lower) Bitcoin prices. |
|---|