A couple of weeks ago, Coindesk launched an ICO tracker which seems quite comprehensive and includes data starting in 2014. It has information on 164 ICOs1 I downloaded the data on 18 August but was unable to replicate some of the charts Coindesk has on its web site. The data I downloaded ends on 27 July of this year whereas the Coindesk site includes data until 31 July. and the data is expected to be updated every week or so.
In a recent post, I shared some insights on the nature of ICOs. In a nutshell, ICOs should not be equated with crowdfunding nor are they comparable to the more traditional IPOs. What has really changed since my initial posting is the fact that SEC is now planning to get involved in the process and will soon start to regulate how ICOs are run and managed. In the meanwhile, ICOs continue to grow in almost exponential fashion – some of them collecting millions of USD in a few hours or days.
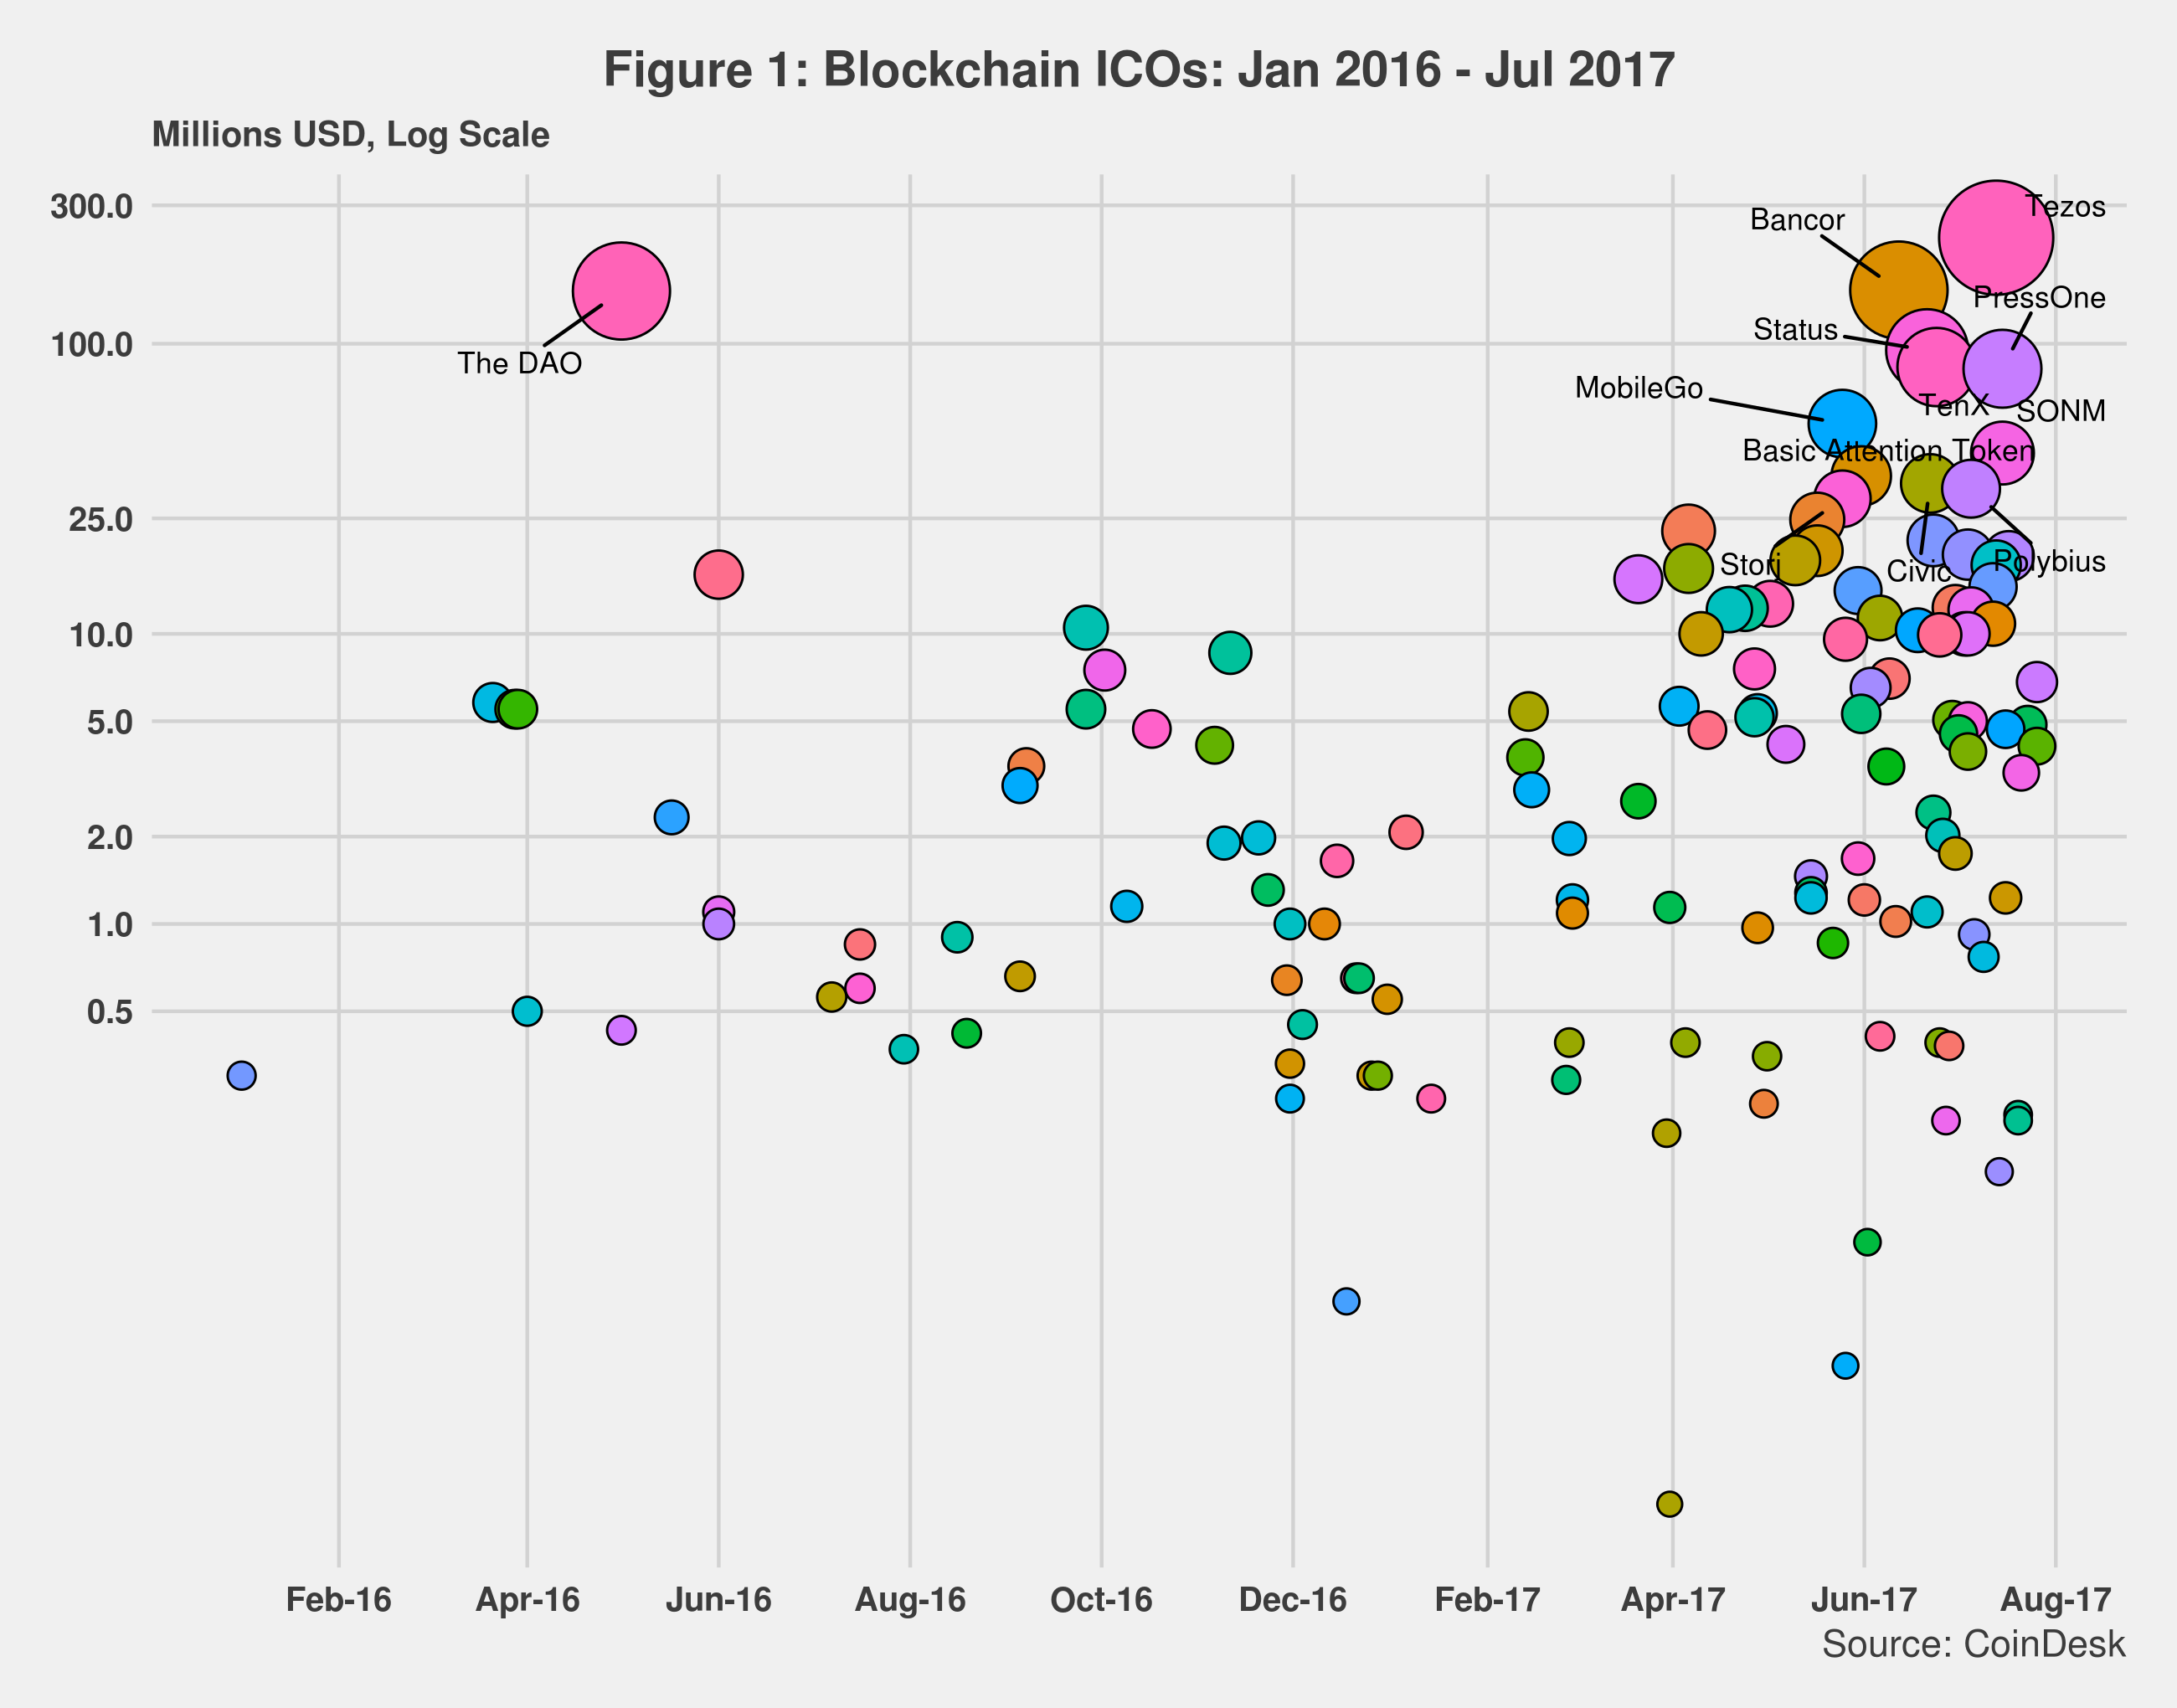 Figure 1 provides a snapshot of all ICOs completed since January 2016. It also highlights the start-ups that collected 25 million USD or more during the process. From the graph, we can detect the following patterns: 1. The number of ICOs has increased over time, especially since last April; 2. In 2016, only one ICO, The DAO, attracted more than 25 million USD. This year 11 ICOs have already crossed that barrier, and several more are expected to do so before the end of the year, And 3. Capital dispersion among ICOs is also increasing as many ICOs have a hard time attracting more than half a million dollars of investment, whereas very few are getting hundreds of millions. Not surprisingly, the median for all ICOs included in the tracker is $1.93 million.2 Given the sample size and the fact that we have a few outliers, the median value is more significant here than the usual mean.
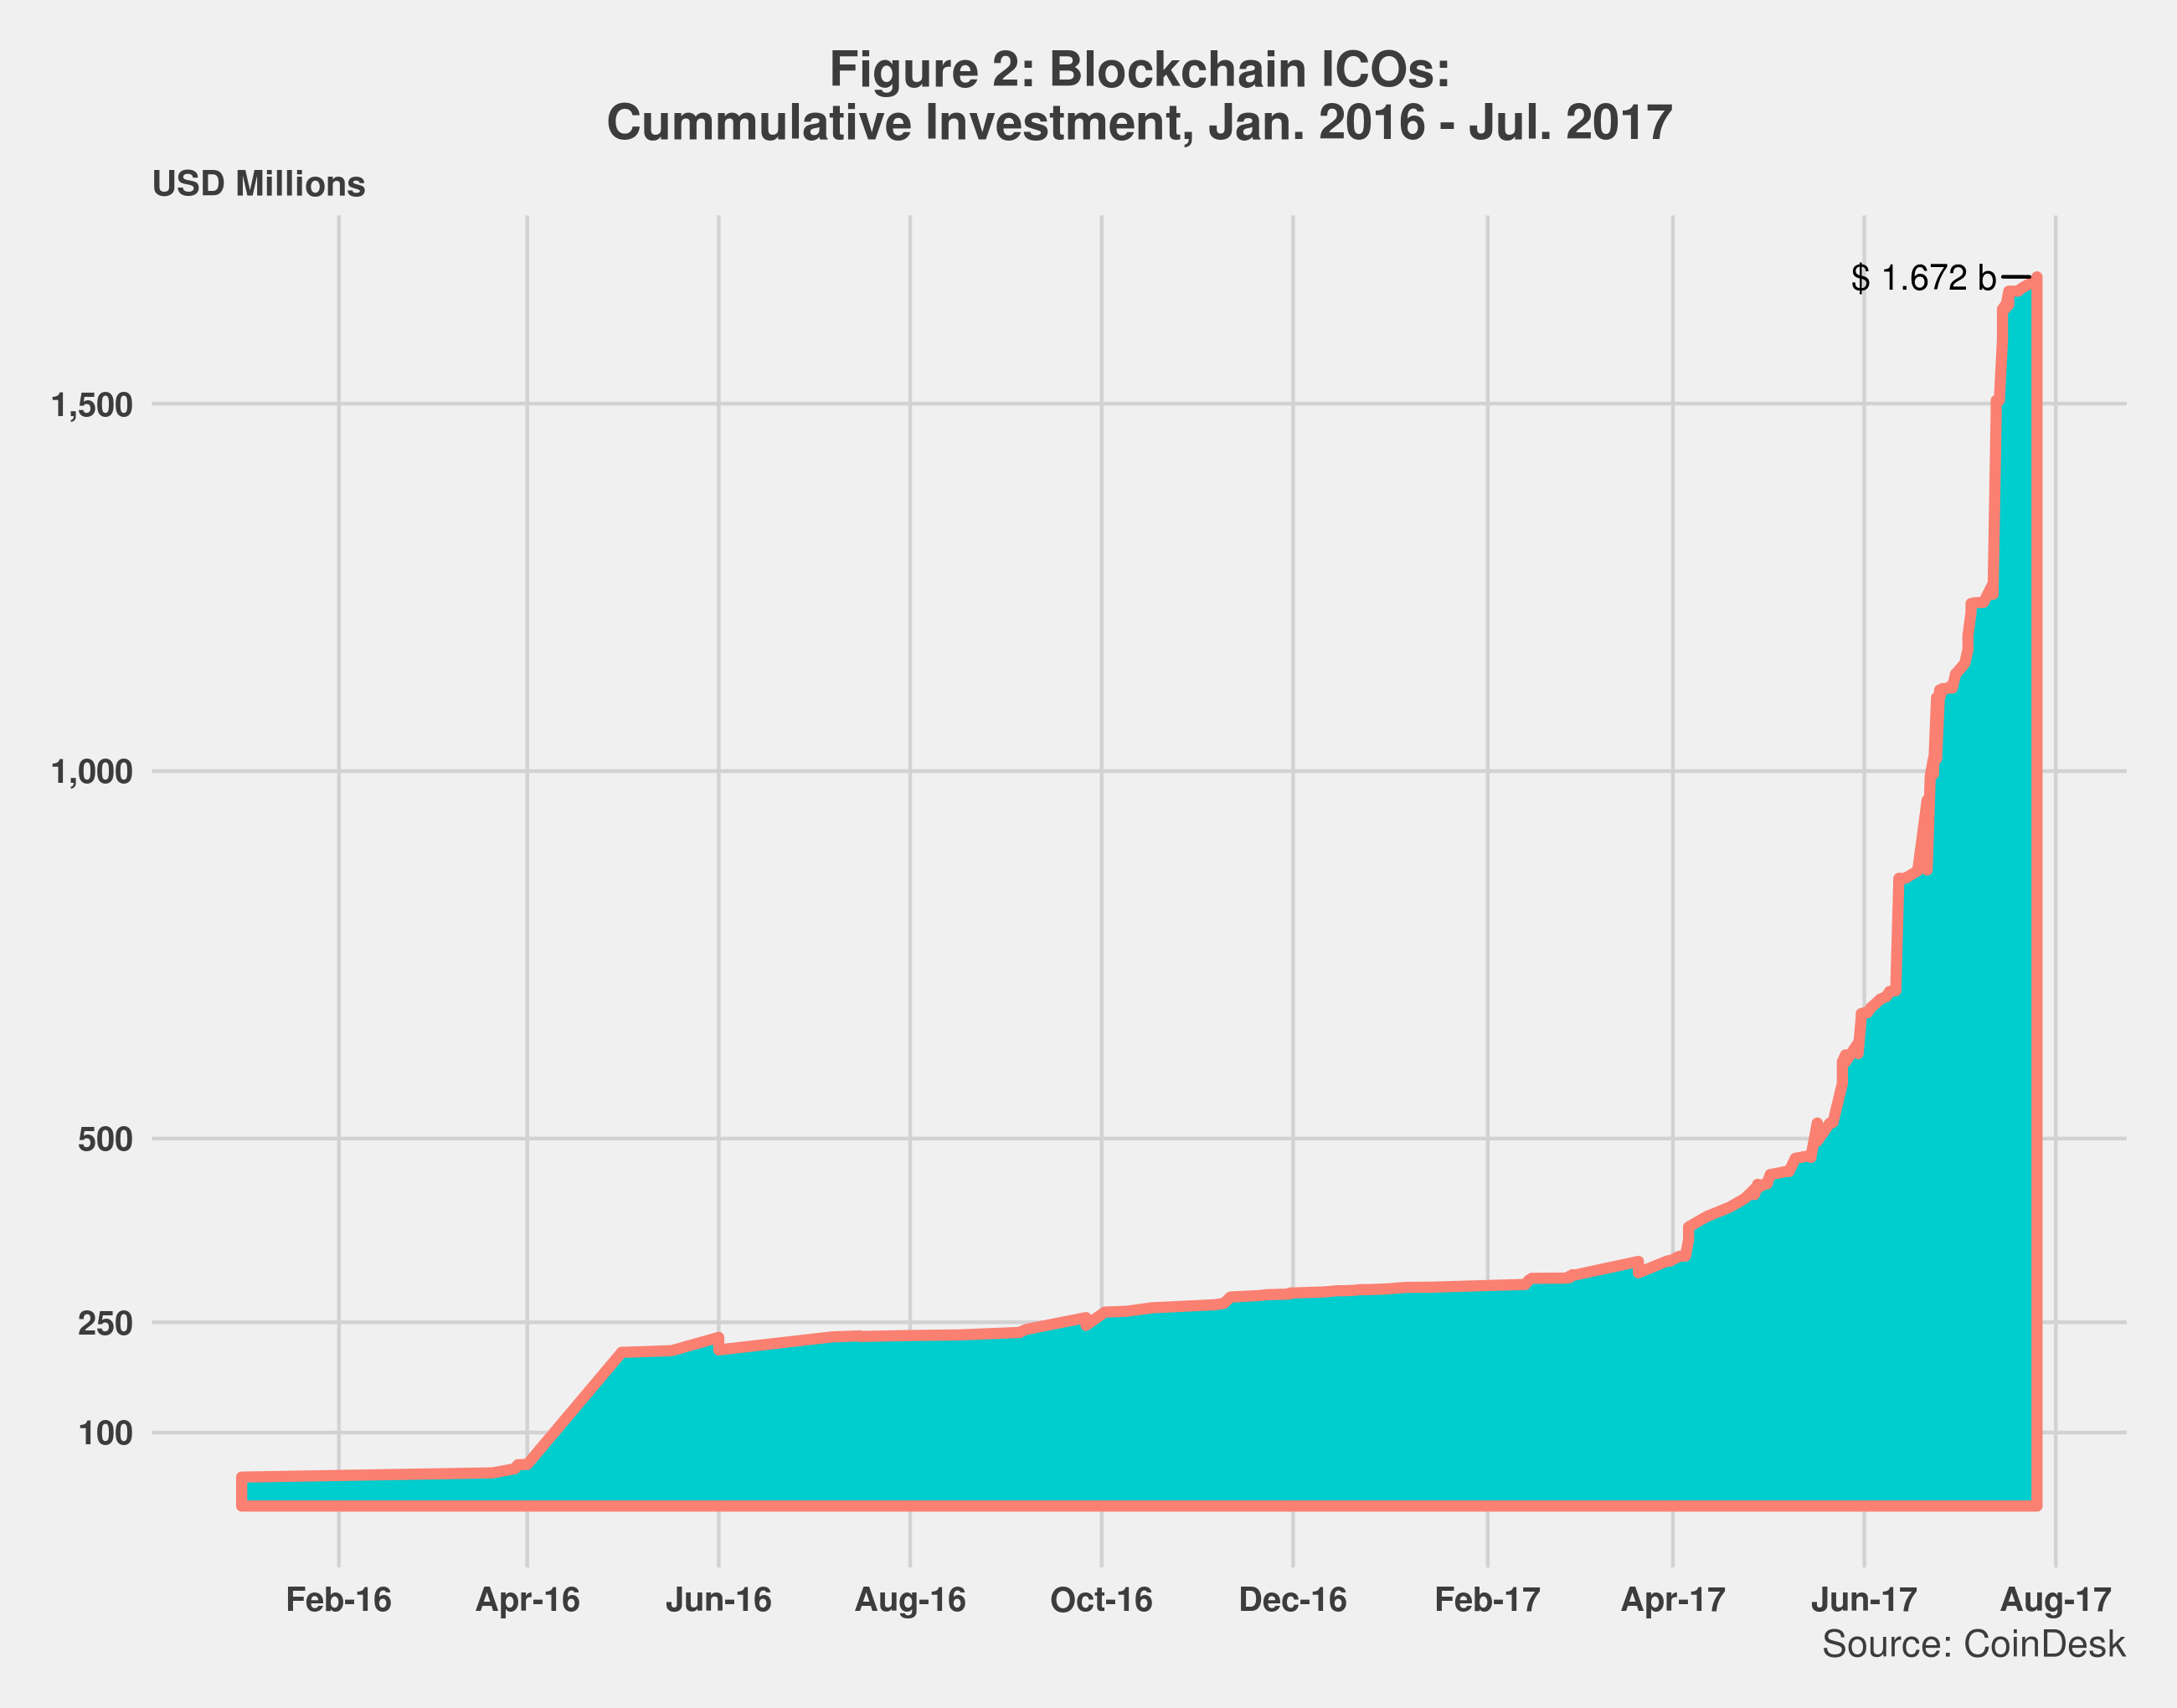
 As seen in figure 2, total ICO investment is now close to 1.7 billion USD. Note that the graph does not include data for 2014 and 2015 as capital invested was relatively small back then. Excluding such data also helps highlight investment trends. The first jump occurred in May 2016 when The DAO ICO was completed. Another apparent acceleration started in April of this year, and in recent months ICO investment has grown exponentially, almost off the charts.
The Internet economy seems to be intimately associated with power-law distributions: A few get most of the benefits while the rest get to pick up the breadcrumbs. ICOs are not immune to such distributions, as shown in figure 3. 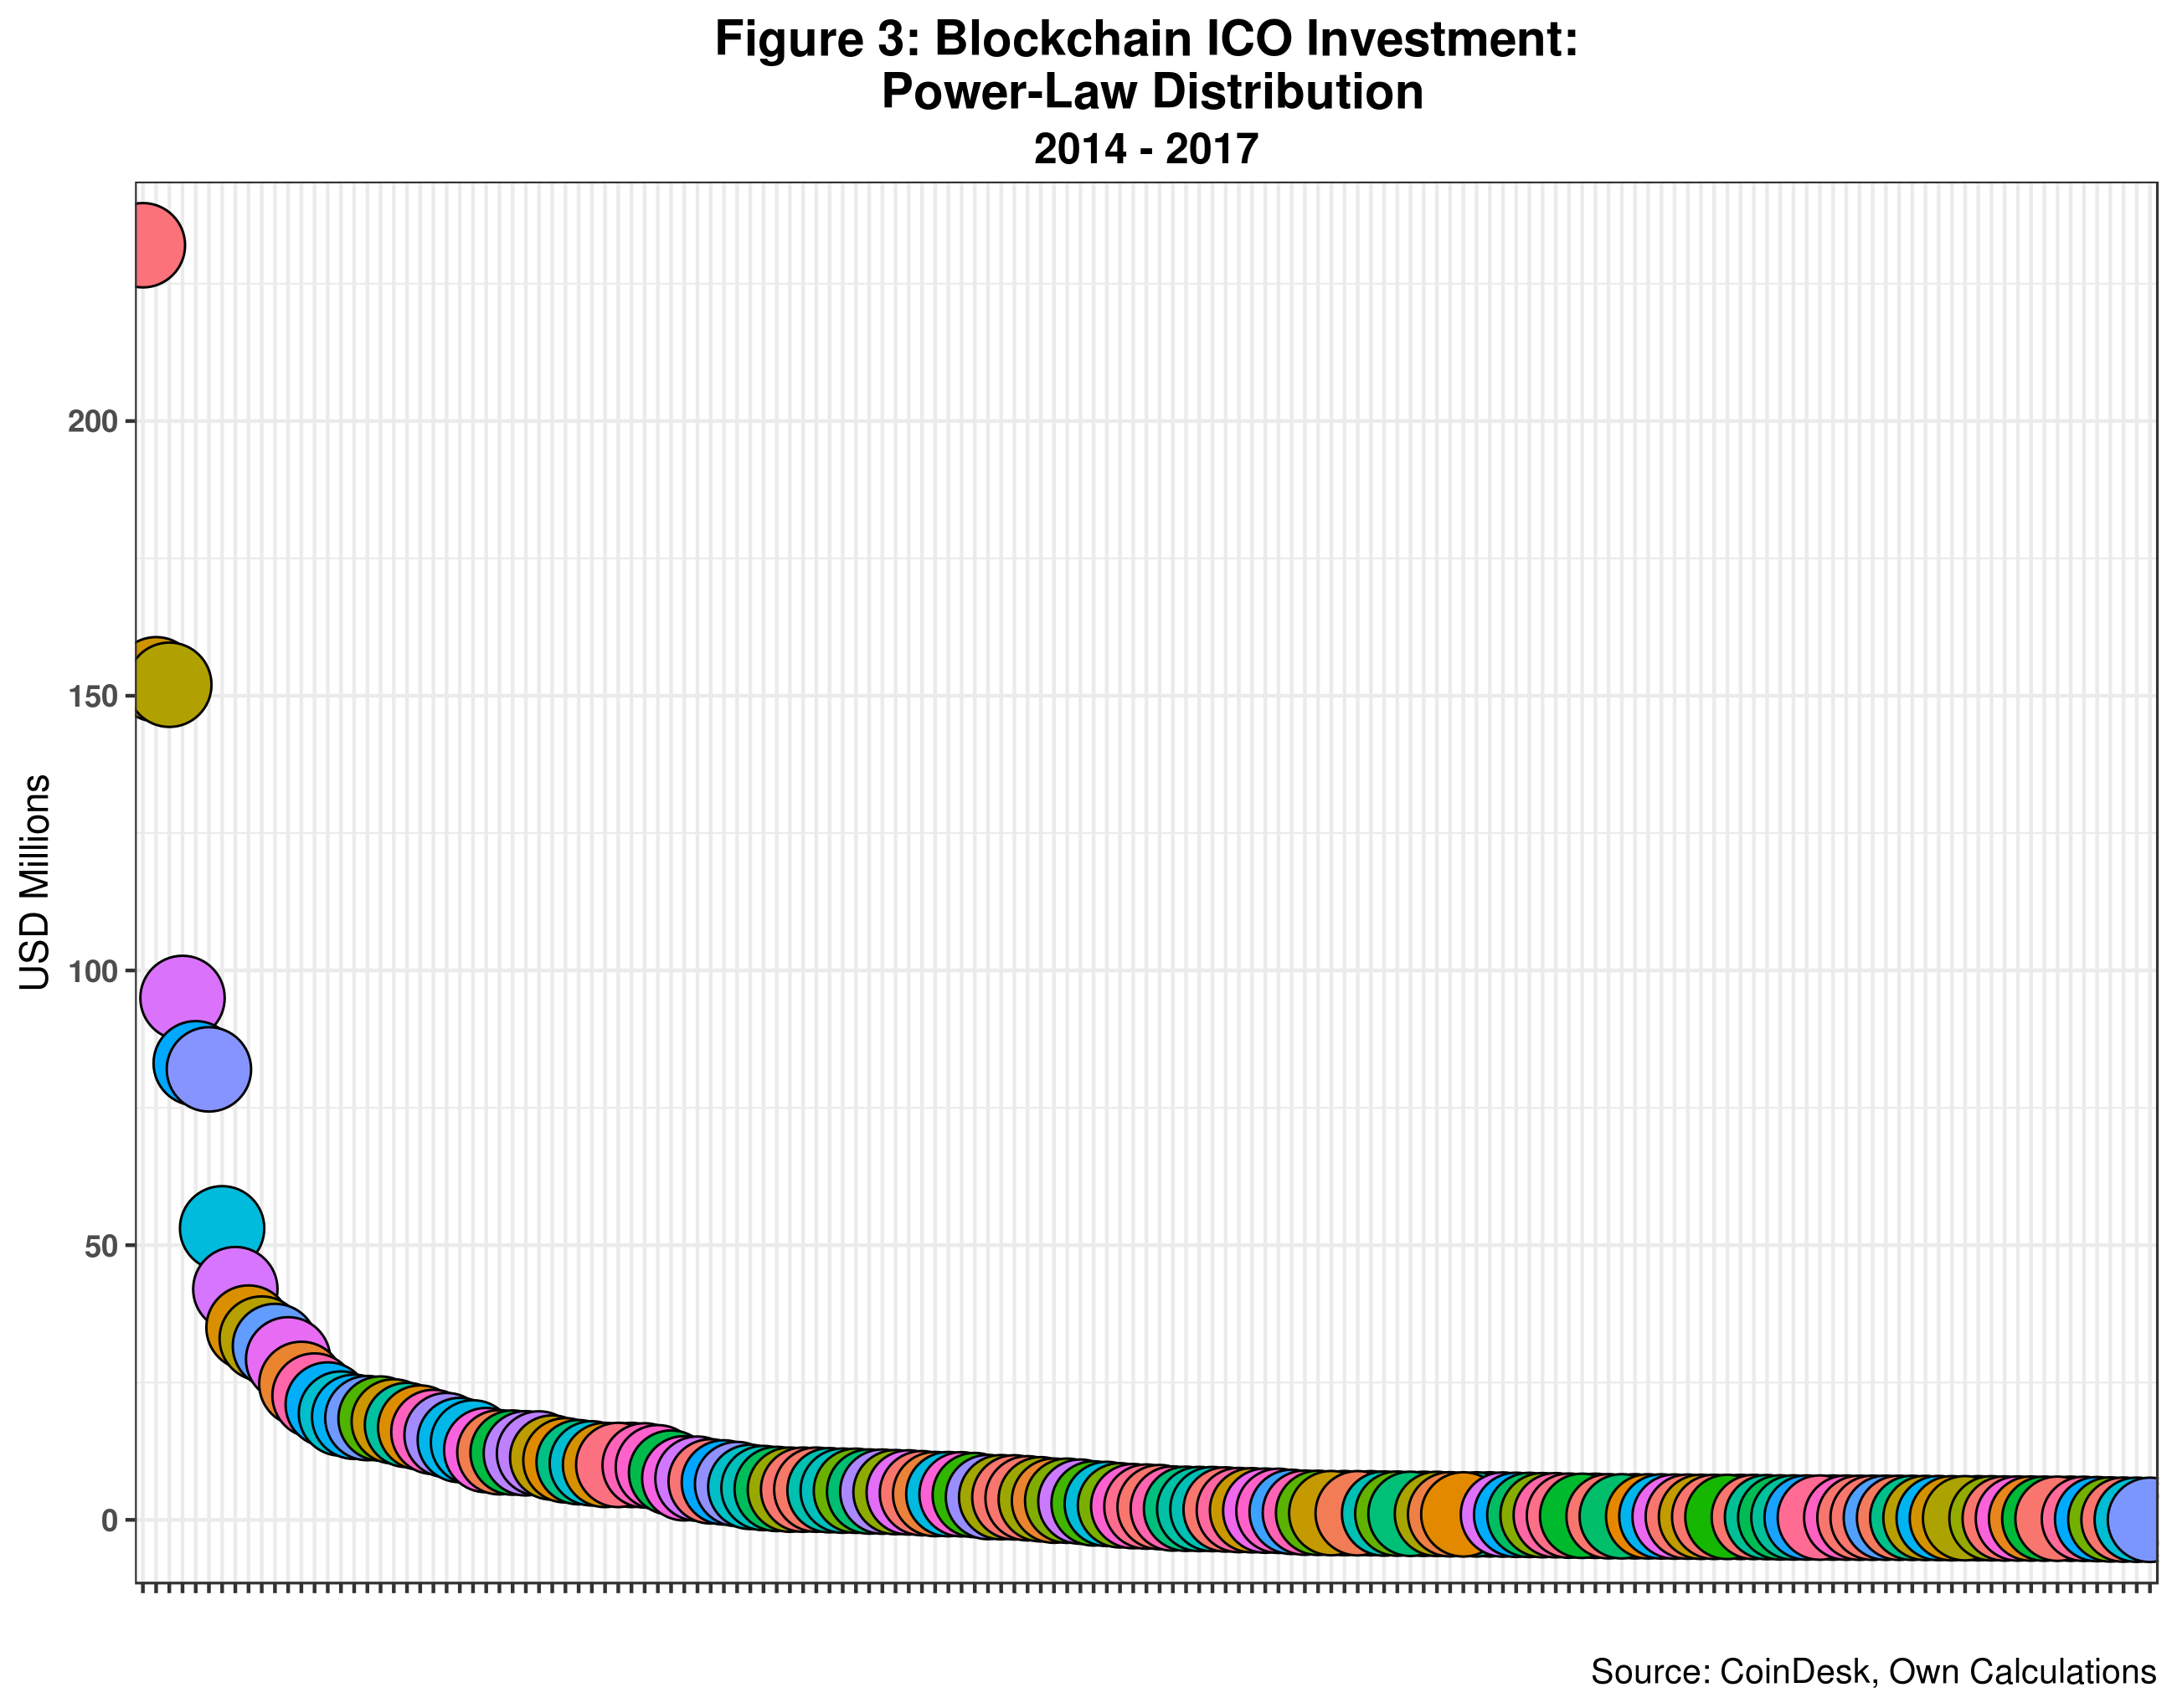 Eight start-ups or so capture the lion’s share of the capital invested in ICOs. Most other firms attract much less investment even though the had successful ICOs.
This is certainly not bad news for new start-ups that had even less access to capital before the dawn of the “ICO era”. Most probably this opportunity window will close once the SEC gets into the action.
Figure 4 sheds additional light on the nature of ICOs power-law distributions. For starters, seven firms or startups (4.3% of the total) get over 51% of all capital invested on ICOs. By the same token, 90.2% of companies have to share 33% of all ICO investments. 33% of 1.67 billion dollars is certainly not an insignificant number: just over 560 million to be split among 147 start-ups. But such split does not happen on equitatative fashion. In fact, 68% of all firms (114 startups) in the sample only get 11% of the spoils.

Certainly, poverty of startups is not an issue here. But inequality among blockchain technology start-ups engaged in ICOs is wide. The Gini coefficient of the CoinDesk ICO sample is 0.783 which is on the high side, as expected.
From an economic viewpoint, this is just the effect of intense competition in the sector. Start-ups that have completed ICOs and are working in the same area or themes as others more successful will probably not survive in the short to medium terms. Similarly, blockchain startups planning to launch ICOs should in principle avoid direct competition with the top 10% firms backed by massive amounts of capital.
Given the current sample size and existing distribution of ICO financing, the probability of running an ICO that could raise over 25 million USD is just over 7%. Not as bad as lotto odds, that is for sure.
But running a successful ICO is not just a matter of luck. Start-ups willing to undertake an ICOs should have 1. A professional team with an excellent reputation in the sector they are planning to work as well as relevant blockchain expertise; 2. A state-of-the-art ICO campaign run by a professional team with good PR, communications and social media skills; and 3. A clear and transparent framework that protect investors and ensure their money will generate benefits in the medium to long runs – or will be returned if the firm is unable to deliver the goods.
Cheers, Raúl

Endnotes
| ⇧1 | I downloaded the data on 18 August but was unable to replicate some of the charts Coindesk has on its web site. The data I downloaded ends on 27 July of this year whereas the Coindesk site includes data until 31 July. |
|---|---|
| ⇧2 | Given the sample size and the fact that we have a few outliers, the median value is more significant here than the usual mean. |
Comments
One response to “Blockchain ICOs Revisited”