
As expected, ICOs are finally cooling down. There are several reasons for this. First, ICO oversight by regulators in many countries has substantially increased. Regulators are poking not so much into new ICOs. Instead, they are doing deep dives into those that have already been completed and going after those who look fraudulent. Second, the token market is in a massive downswing. Some tokens have lost at least 90 percent of their value, leading to substantial losses for ICO investors. As a result, crypto tokens have become much less attractive.
Third, many of the successfully completed ICOs have a hard time showing or delivering on the ground results despite massive infusions of capital. While lack of maturity and technology constraints might play a role here, it may also be too early to tell. And finally, the emergence of so-called stable tokens to quash the market’s financial instability can become a disincentive to acquiring crypto-tokens. Stable tokens are pegged to regular currencies. In principle, they could beg the issue of token issuance – on top of adding yet more complexity to the tokens-as-securities issue.
So what does the latest data actually show?
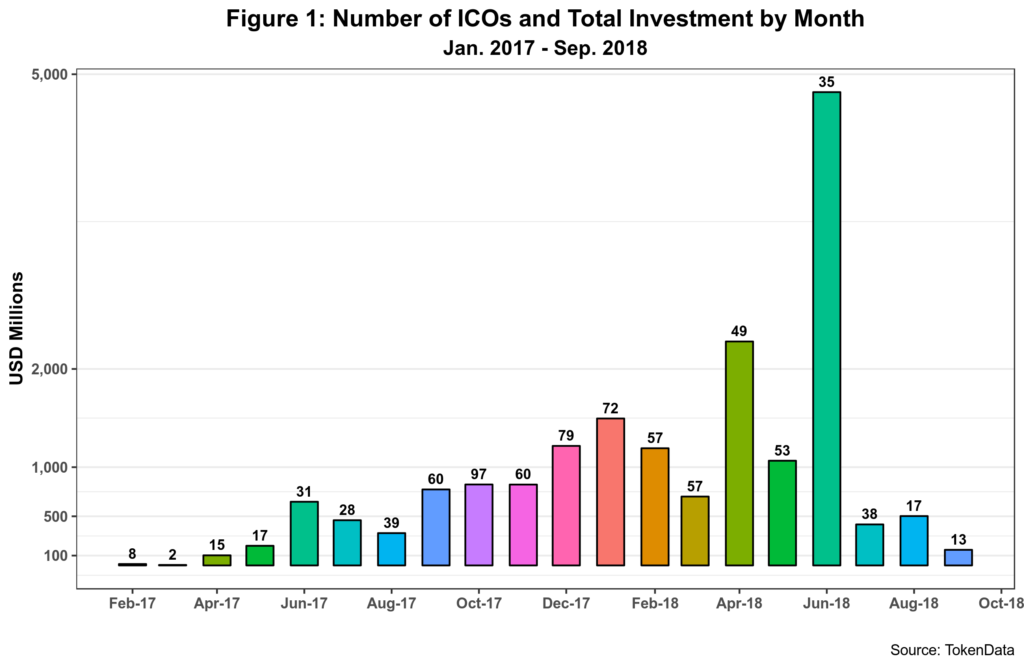 Figure 1 above cleanly captures the declining trend regarding both the number of ICOs and total investment attracted. June 2018, however, takes top honors as the month that holds the record for most investment since ICOs started. The one-year EOS ICO process is the culprit here. This ICO alone received over 4.2 billion dollars (the largest so far), representing 88% of the total funds invested in ICOs during that month. If EOS is excluded from the data, then it is possible to conclude that ICOs have been falling since April. On the other hand, September 2018 is now almost at the same level as April 2017.
Aggregating the data by quarter shows the same trend in a perhaps optimal fashion.
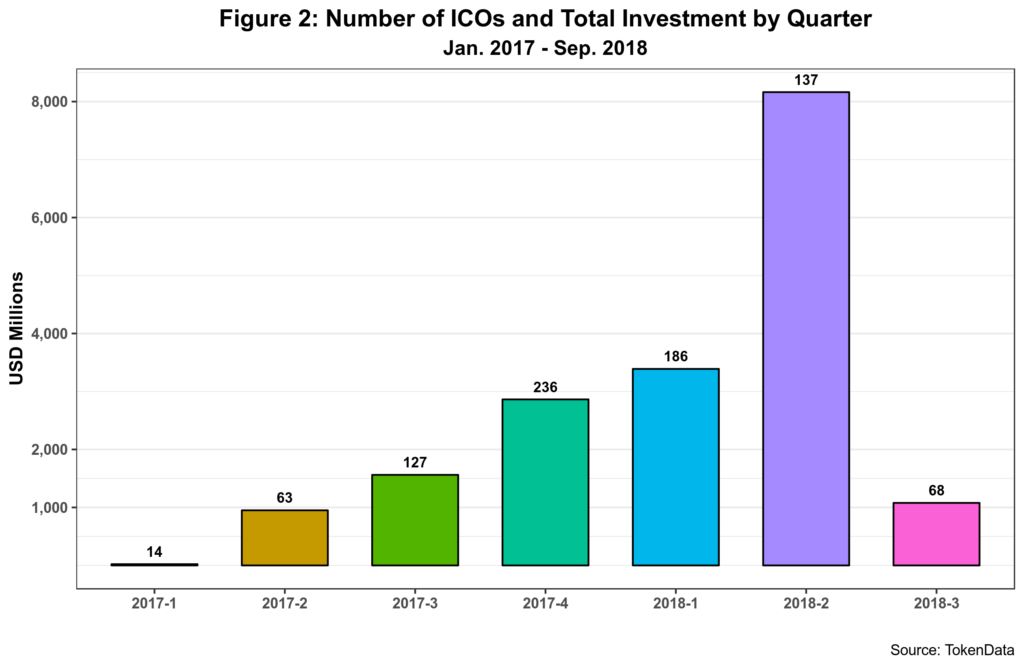 Ignoring the EOS process again, Figure 2 shows ICOs peaked in the first quarter of this year and had fallen since for both number and total capital invested. By the third quarter of this year, the latter dropped over 200% from its maximum in the first three months. The last quarter of 2017 was the month with the most significant number of successful ICOs – and will probably remain unbeaten for a long time, if not forever.
The same goes for median ICO income, presented in figure 3.
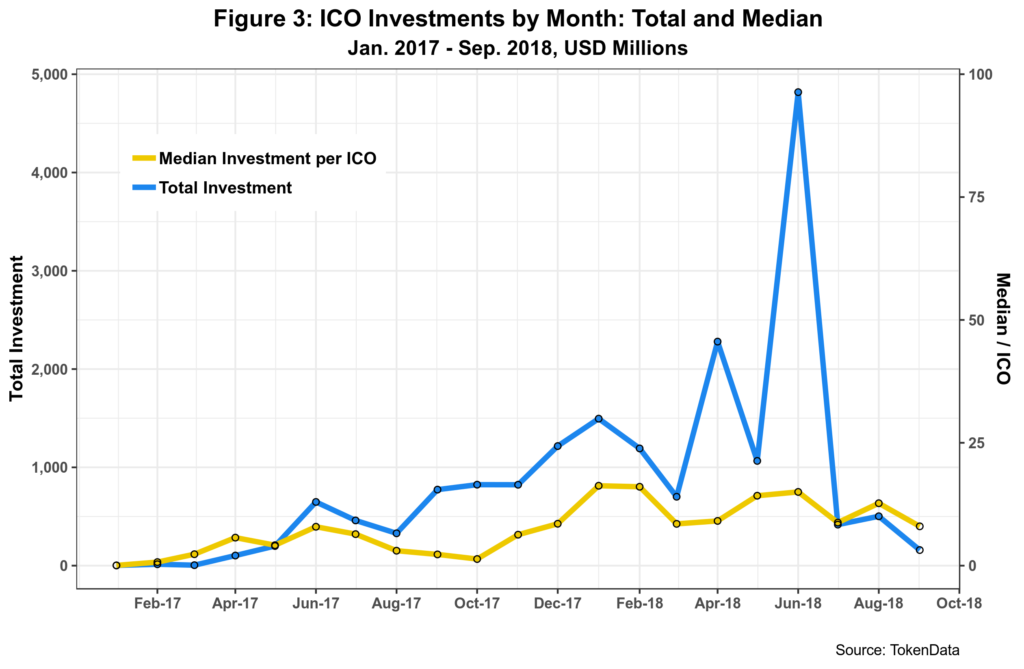 ICO median investment peaked in January this year at 16.25 million dollars per ICO. By September is has fallen more than 100% to 8 million dollars. This should not be a surprise as both ICOs and capital invested numbers decreased substantially during the third quarter of 2018. Concerning the number of ICOs, the rate of decline is very similar, just over 100%. Note that even with EOS included, June 2018 was not the best month for median ICO income.
Data thus confirm the steep decline of ICOs. Will ICOs rebound? The answer is probably negative, given the various factors enumerated at the beginning of this post. While ICOs can still leverage decent amounts of capital, given the median average investment of 8 million dollars, the good old days are probably gone for good. Maybe IPOs will make a big comeback sometime soon.
One key legacy of the ICO bubble was its capital distribution patterns, as shown in Figure 4.
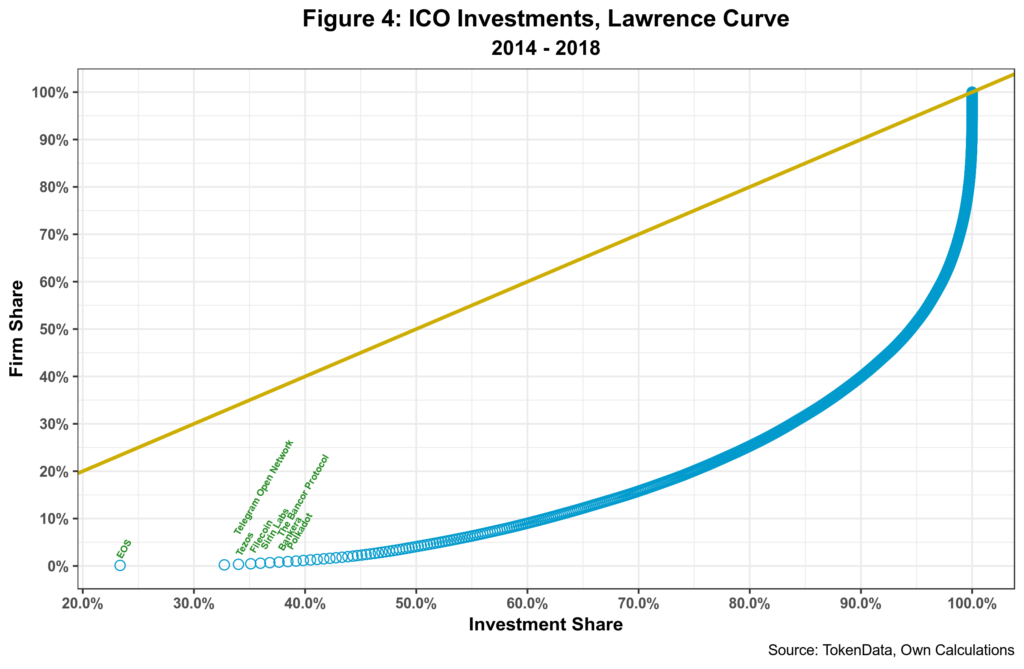 The top eight ICOs attracted 38.5% of total capital flowing into the sector. That is, the 1% got almost 40% of all income generated by the ICO process. On the other hand, many small startups and firms raised essential amounts of capital that otherwise would have been impossible to obtain without an ICO process.
In the end, we got some “democratization” in the access to venture capital accompanied by heavy concentration and sharp inequality when it comes to distribution.
Will these smaller ventures deliver the goods? We will see.
Cheers, Raúl
