In this sequel post, I will look at the various components of the UNDESA e-government index and then introduce the EIU democracy index to explore potential interlinks between the two,
Components
The e-government development index (EGDI) comprises three distinct components 1. Online services. 2. Telecom infrastructure. And 3. Human capital. While the last two are obtained from external data sources (ITU, UNESCO, UNICEF), the first one is directly developed by the UN. A combination of website checking and a questionnaire sent to UN member states is used to generate the required data – albeit the data is not publicly available. The e-participation index comes from the same source.
The telecom index relies on user access to the Internet, mobiles, analog phones, and broadband. The human capital index is, in reality, a measure of the overall education levels within a given country – and thus pretty similar to one of the three components used to calculate UNDP’s Human Development Index. All three pillars aggregate multiple variables which are normalized to create an index for each. EGDI is then computed as the weighted average of these three subindices.
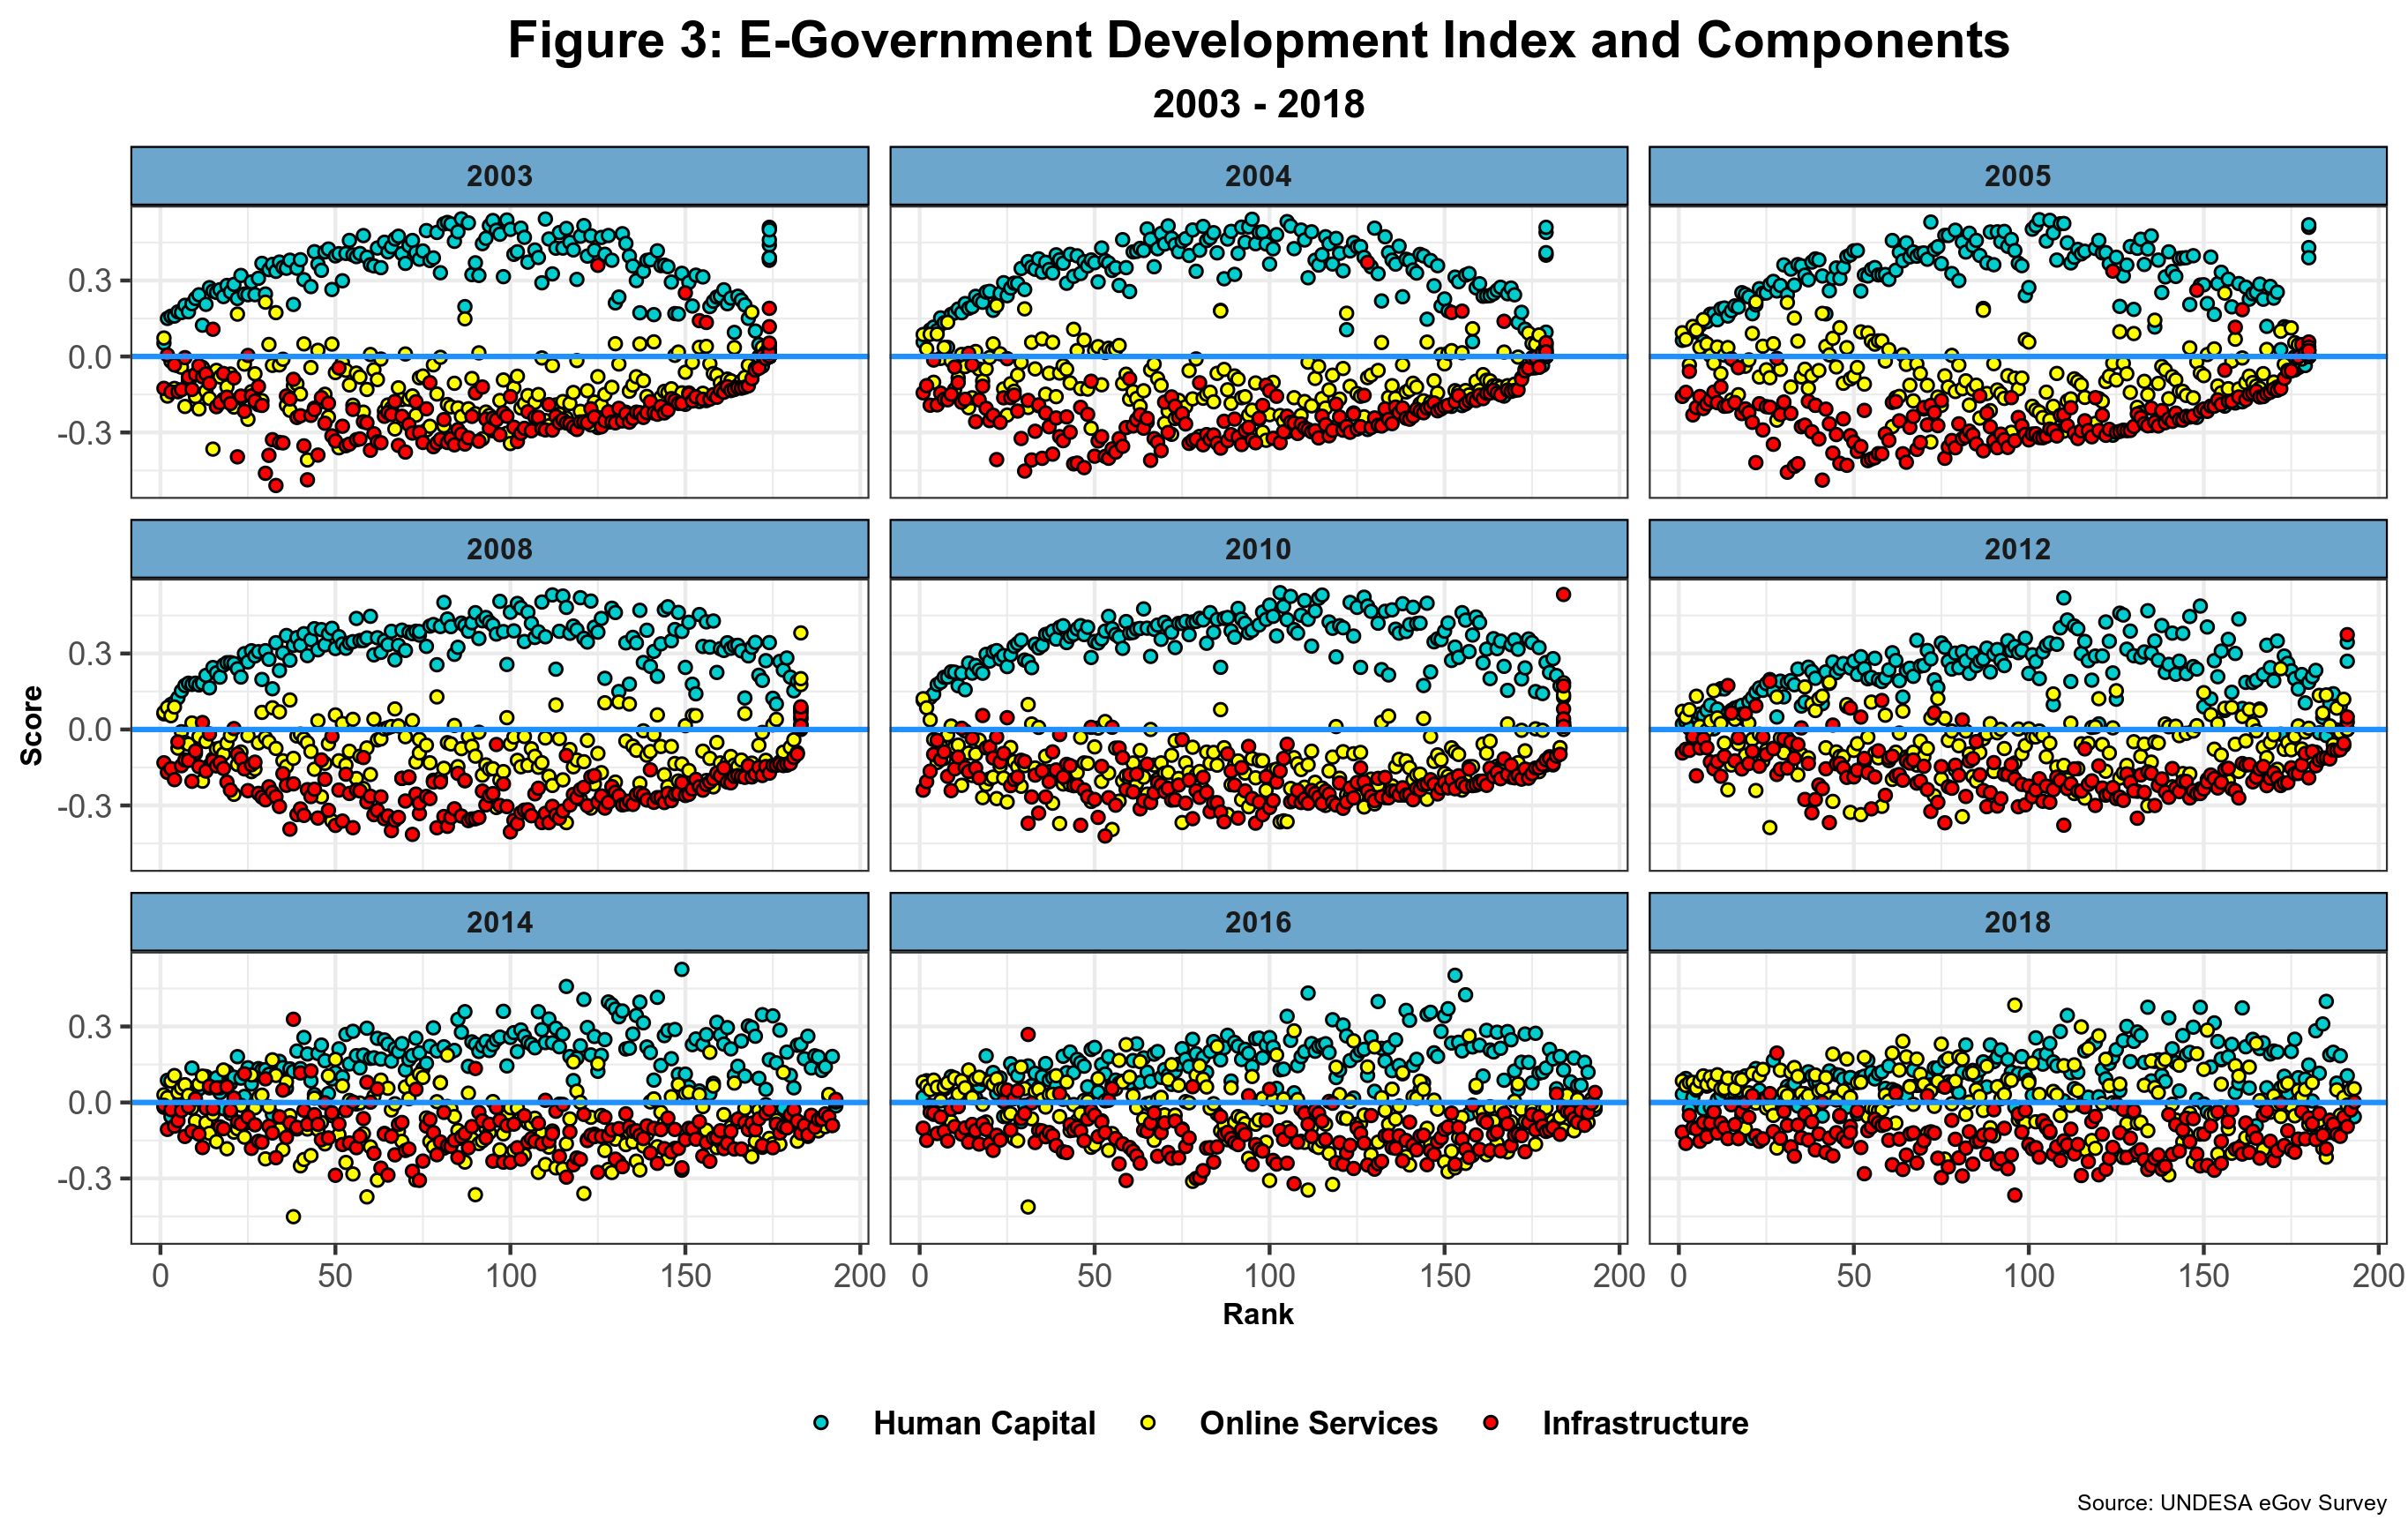
Figure 3 below shows the country distribution of each c.omponent vis-a-vis the respective e-government index score – denoted by the horizontal blue line. Each country is represented by three bubbles, one for each component that, together, comprise the EGDI score. Each bubble, in turn, is calculated by subtracting the EGDI score from the respective subindex. Bubbles over the zero line indicate that the value of the subindex is larger than the EDGI score. Values below zero show the opposite. Outliers have been purposedly excluded, and the data is sorted by EGDI rank.
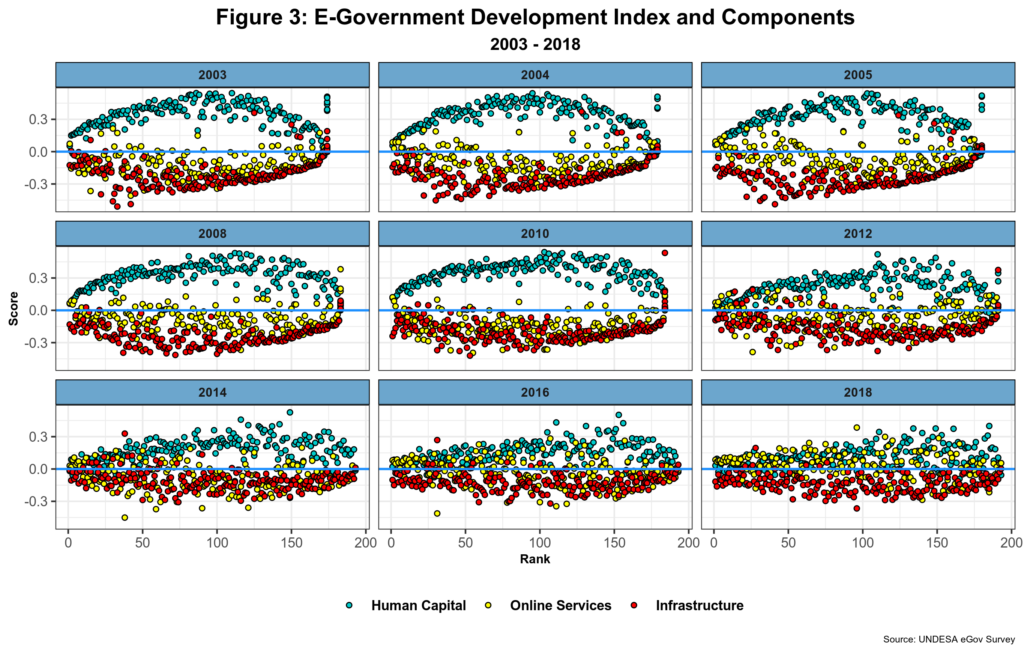
Some interesting patterns can be detected. First, since its inception, the human capital subindex has exceeded the EGDI score. By 2018 only a handful of countries yielded values below EGDI. On the other hand, telecom infrastructure scores have been consistently lower, with only a few nations reporting amounts more significant than EGDI in the last report. Third, the online service subindex shows a very different behavior as it started almost hand in hand with telecom infrastructure, mostly behind EGDI. In 2012, it began to shift upwards, and by 2018, a majority of countries report scores larger than EGDI. By 2018, however, online service scores were more evenly distributed around EGDI, unlike the other two pillars. Finally, note that all three subindices are converging towards EGDI, a process that seems to have commenced in 2012.
Changes in the way the subindexes are compiled partly explain these changes. The human capital calculation was changed in 2014 by adding two additional indicators leading to a relative decrease in overall scores. Telecom infrastructure has also been modified first in 2008 by dropping TV sets and then in almost every report until 2018 – emphasis now placed on broadband access and wireless connectivity. Recall that the online services subindex is directly estimated by UNDESA and relies on both member state inputs and comprehensive analysis of national government websites. Improvements in both the methodology and data collection have probably led to the dramatic shift in this subindex, but a full and more detailed explanation will demand a thorough analysis of the data series. The convergence process could be the result of real improvements in the various indicators aggregated within the EGDI, especially when it comes to telecom infrastructure. But explaining why human capital is decreasing is perhaps a bit more challenging unless we assume the early years were foreshadowed by great optimism.
The evolution of the average values for EGDI and its components, depicted in figure 4, seems to confirm this.
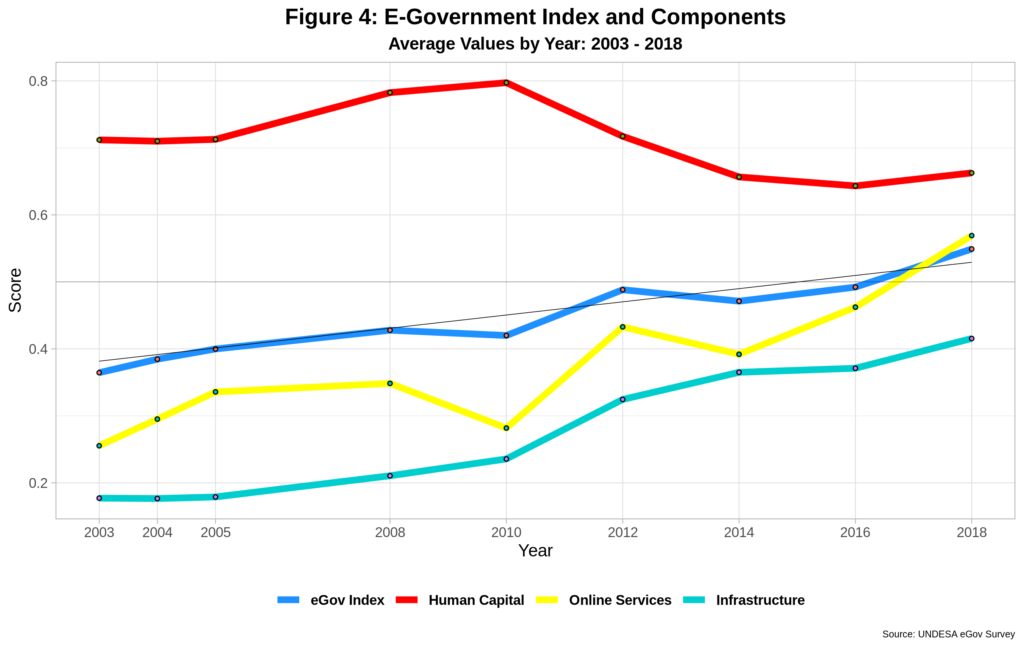
The human capital decline started in 2010 and thus cannot be explained by the 2014 estimation changes. In any event, it is the only component that has experienced such a fate, decreasing 17% since 2010, albeit recovering a bit (about 3%) in the last report. The other two subindices have rapidly increased, particularly since that same year. Here, online services take top honors as it has risen by over 100% in that period. And for the first time in 2018, its average score beats that of EGDI. Comparatively, the latter has grown 30% in the last eight years. On the other hand, infrastructure has proven to be the most stable of all pillars, steadily increasing from the very start and reporting a 73% gain since 2010. Correlation wise, human capital does not manage to cross the 0.50 coefficient barrier when associated with both online services and infrastructure.
We thus have a situation where the steady growth in EGDI has been accompanied by a relatively significant decline in human capital indicators across the board. In the end, gains in EGDI have relied on the growth of both online services and telecom infrastructure with the former being the prime mover in the last four years. A simple regression analysis of the EGDI and its components indicates that online services account for 37% of the changes in EDGI. On the other hand, the e-participation index growth beats online services as the former has risen almost 200% since 2010 but does not directly factor into EGDI calculations. The reason for such rapid growth is not apparent, however.
Democratic governance
Measuring democracy or the evolution of democratic governance around the globe is probably much more complicated than scoring e-government development. As with the latter, there are a few options out there. For the purposes of this post, I will use the Economist Intelligence Unit (EIU) democracy index (EDI), which has been published since 2006. While not exempt from heavy criticism, the index covers 166 countries and almost matches the year coverage of EDGI. The democracy index is built based on five governance categories, including electoral processes, government capabilities, and civil liberties, among others. Figure 5 below compares the two indices for the period 2012 – 2018.
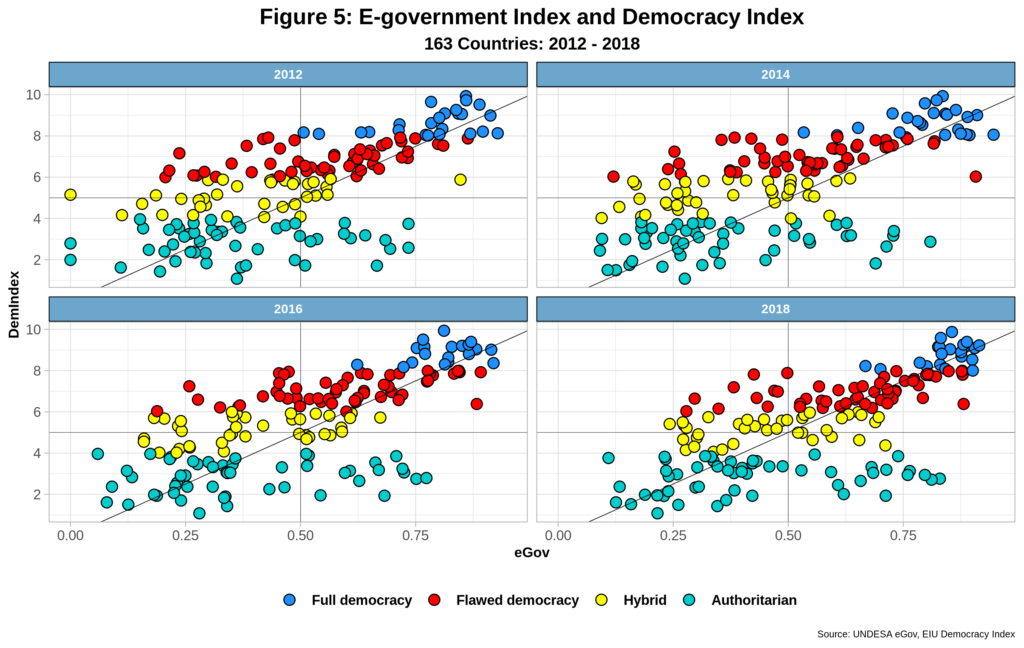
The graph intuitively shows a positive linear correlation between the two indices, which indeed amounts to 0.67, slightly higher than that between EGDI and GDP per capita, mentioned in the previous post. That is, the higher the degree of democratic development, the higher the EGDI score. Nevertheless, there are also quite a few “outliers,” especially for both flawed democracies (an unfortunate label for sure!) and authoritarian regimes. A bunch of countries under the latter rubric are excelling when it comes to EGDI, and their number has steadily increased since 2012. Some even outperform fully democratic nations. On the other hand, flawed democracies with relatively high democracy index scores, some even close to full democracies, are underperforming in terms of e-government development. By the same token, more than 50% of all hybrid regimes have EGDI scores below 0.5.
The graph also shows most countries moving from left to right across time and jumping over the 45-degree line. While in 2012 most nations had higher democracies indices, by 2018 most have comparatively higher EGDIs. This is probably due to the apparent “inflation” spiral of the e-government development index discussed before. On the other hand, the democracy index resembles a tortoise and thus moves slowly over time.
E-participation index and democracy
As mentioned above, e-participation, as measured by UNDESA, has grown almost 200% since 2003, thus outpacing by far all other indices in the process. Recall that the organization is only looking at the supply side of e-participation, which implies that only government activity is captured in the process. At the same time, the e-government survey consistently identifies three types of e-participation: information; consultation; and decision-making. Each of these types, in turn, receives a unique score for every country. Without trying to split hairs here, figuring out how this is accomplished in practical terms is difficult to imagine, especially for the categories of consultation and decision-making where stakeholder involvement, the demand side, is an absolute requirement.
Civil liberties are one of the five pillars of the democracy index. It includes the existence of free media, electronic included, restrictions to accessing the internet, freedom of expression, and institutional mechanisms that allow citizen’s redressing, among others. In other words, the indicator provides an overall perspective on the local environment that either promotes or deters stakeholder interaction with governments and others. Figure 6 depicts the interaction between e-participation and civil liberties for the 2012 – 2018 period.
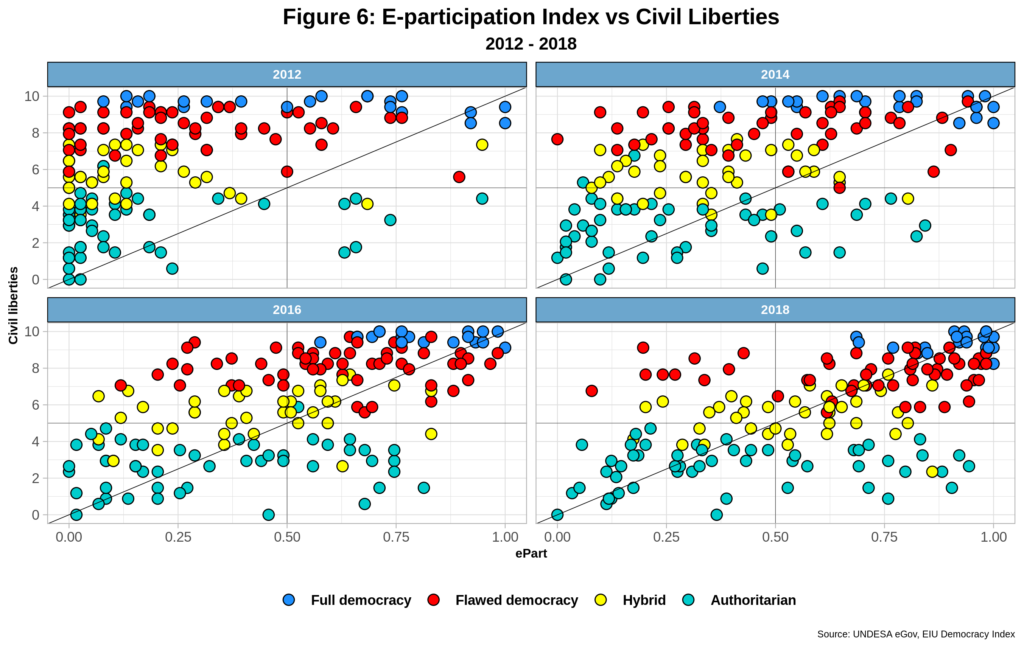
Early on, most countries had shallow e-participation scores, including most full democracies. At the same time, authoritarian regimes led quantitatively with e-participation scores well above the 0.5 mark. The shift from left to right across time is notorious. By 2018, the majority of countries had crossed the 45-degree line reporting e-participation scores bigger than 0.5, including 20 authoritarian regimes. Moreover, a few authoritarian regimes at the bottom of the pyramid in terms of democratic governance show e-participation scores higher than several flawed democracies and hybrid regimes. Outliers seem to prevail here. In fact, the correlation coefficient between the two indicators is less than 0.44. This suggests that civil liberties have little to no influence on the supply-side driven e-participation index of the e-government survey. This, in turn, opens the door for questioning its usefulness for analytical and research purposes.
Government with high capacity and low levels of democracy can indeed create a plethora of “e-participation” websites using the latest technologies, even Artificial Intelligence, and then claim they are indeed directly consulting with stakeholders and involving them in decision-making processes. The only way to counter this is by introducing the demand side of the equation and considering the local civil and political environment that can propel meaningful citizen engagement.
In the end, measuring e-government development (and democracy) is not an easy chore. Fortunately, we already have good data sources and diverse analytical frameworks that provide fertile ground to improve what we have today.
Cheers, Raúl
