ICO data for last February is now available and shown in Figure 1 below.
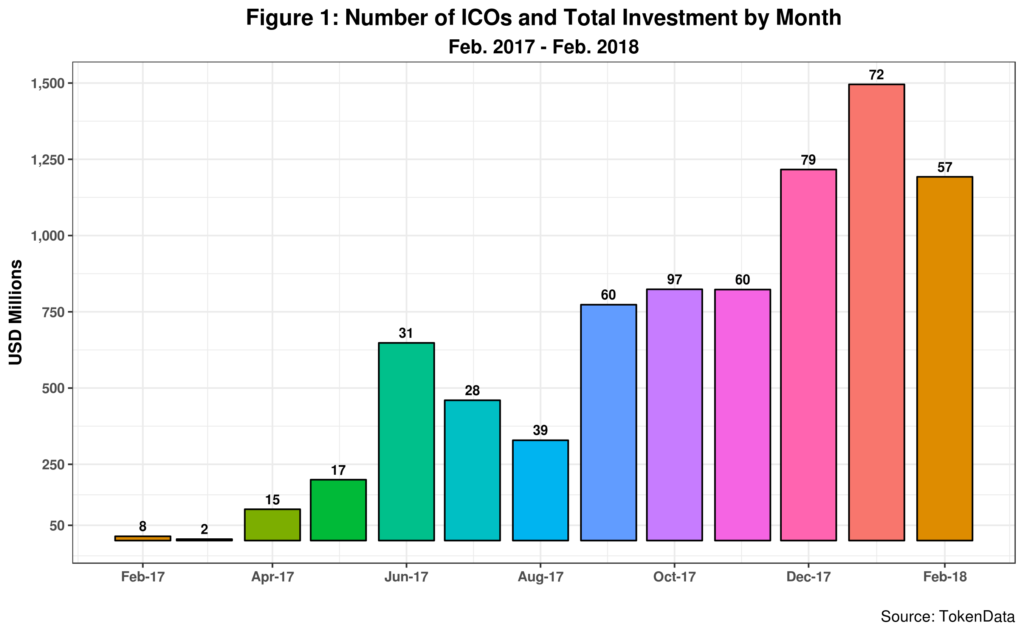
We can immediately see that both the number of ICOs and the total investment volume has decreased. The latter, which amounted to 1.2 billion USD for the month, is 20 percent less than the total for January this year. The same goes for completed ICOs which decreased 21 percent. Among them, only one ICO surpassed 100 million dollars, reaching 150 million. And it managed to distance itself from the runner-up by a cool 100 million.
Figure 2 confirms the decline in total monthly investment but shows that the median declined only slightly or about 1.2%.
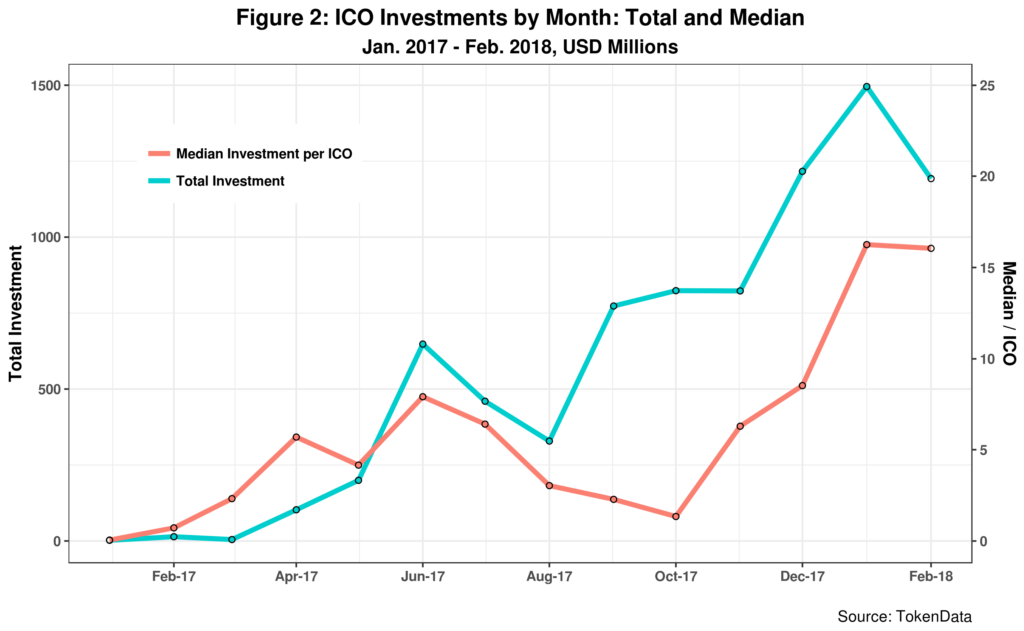
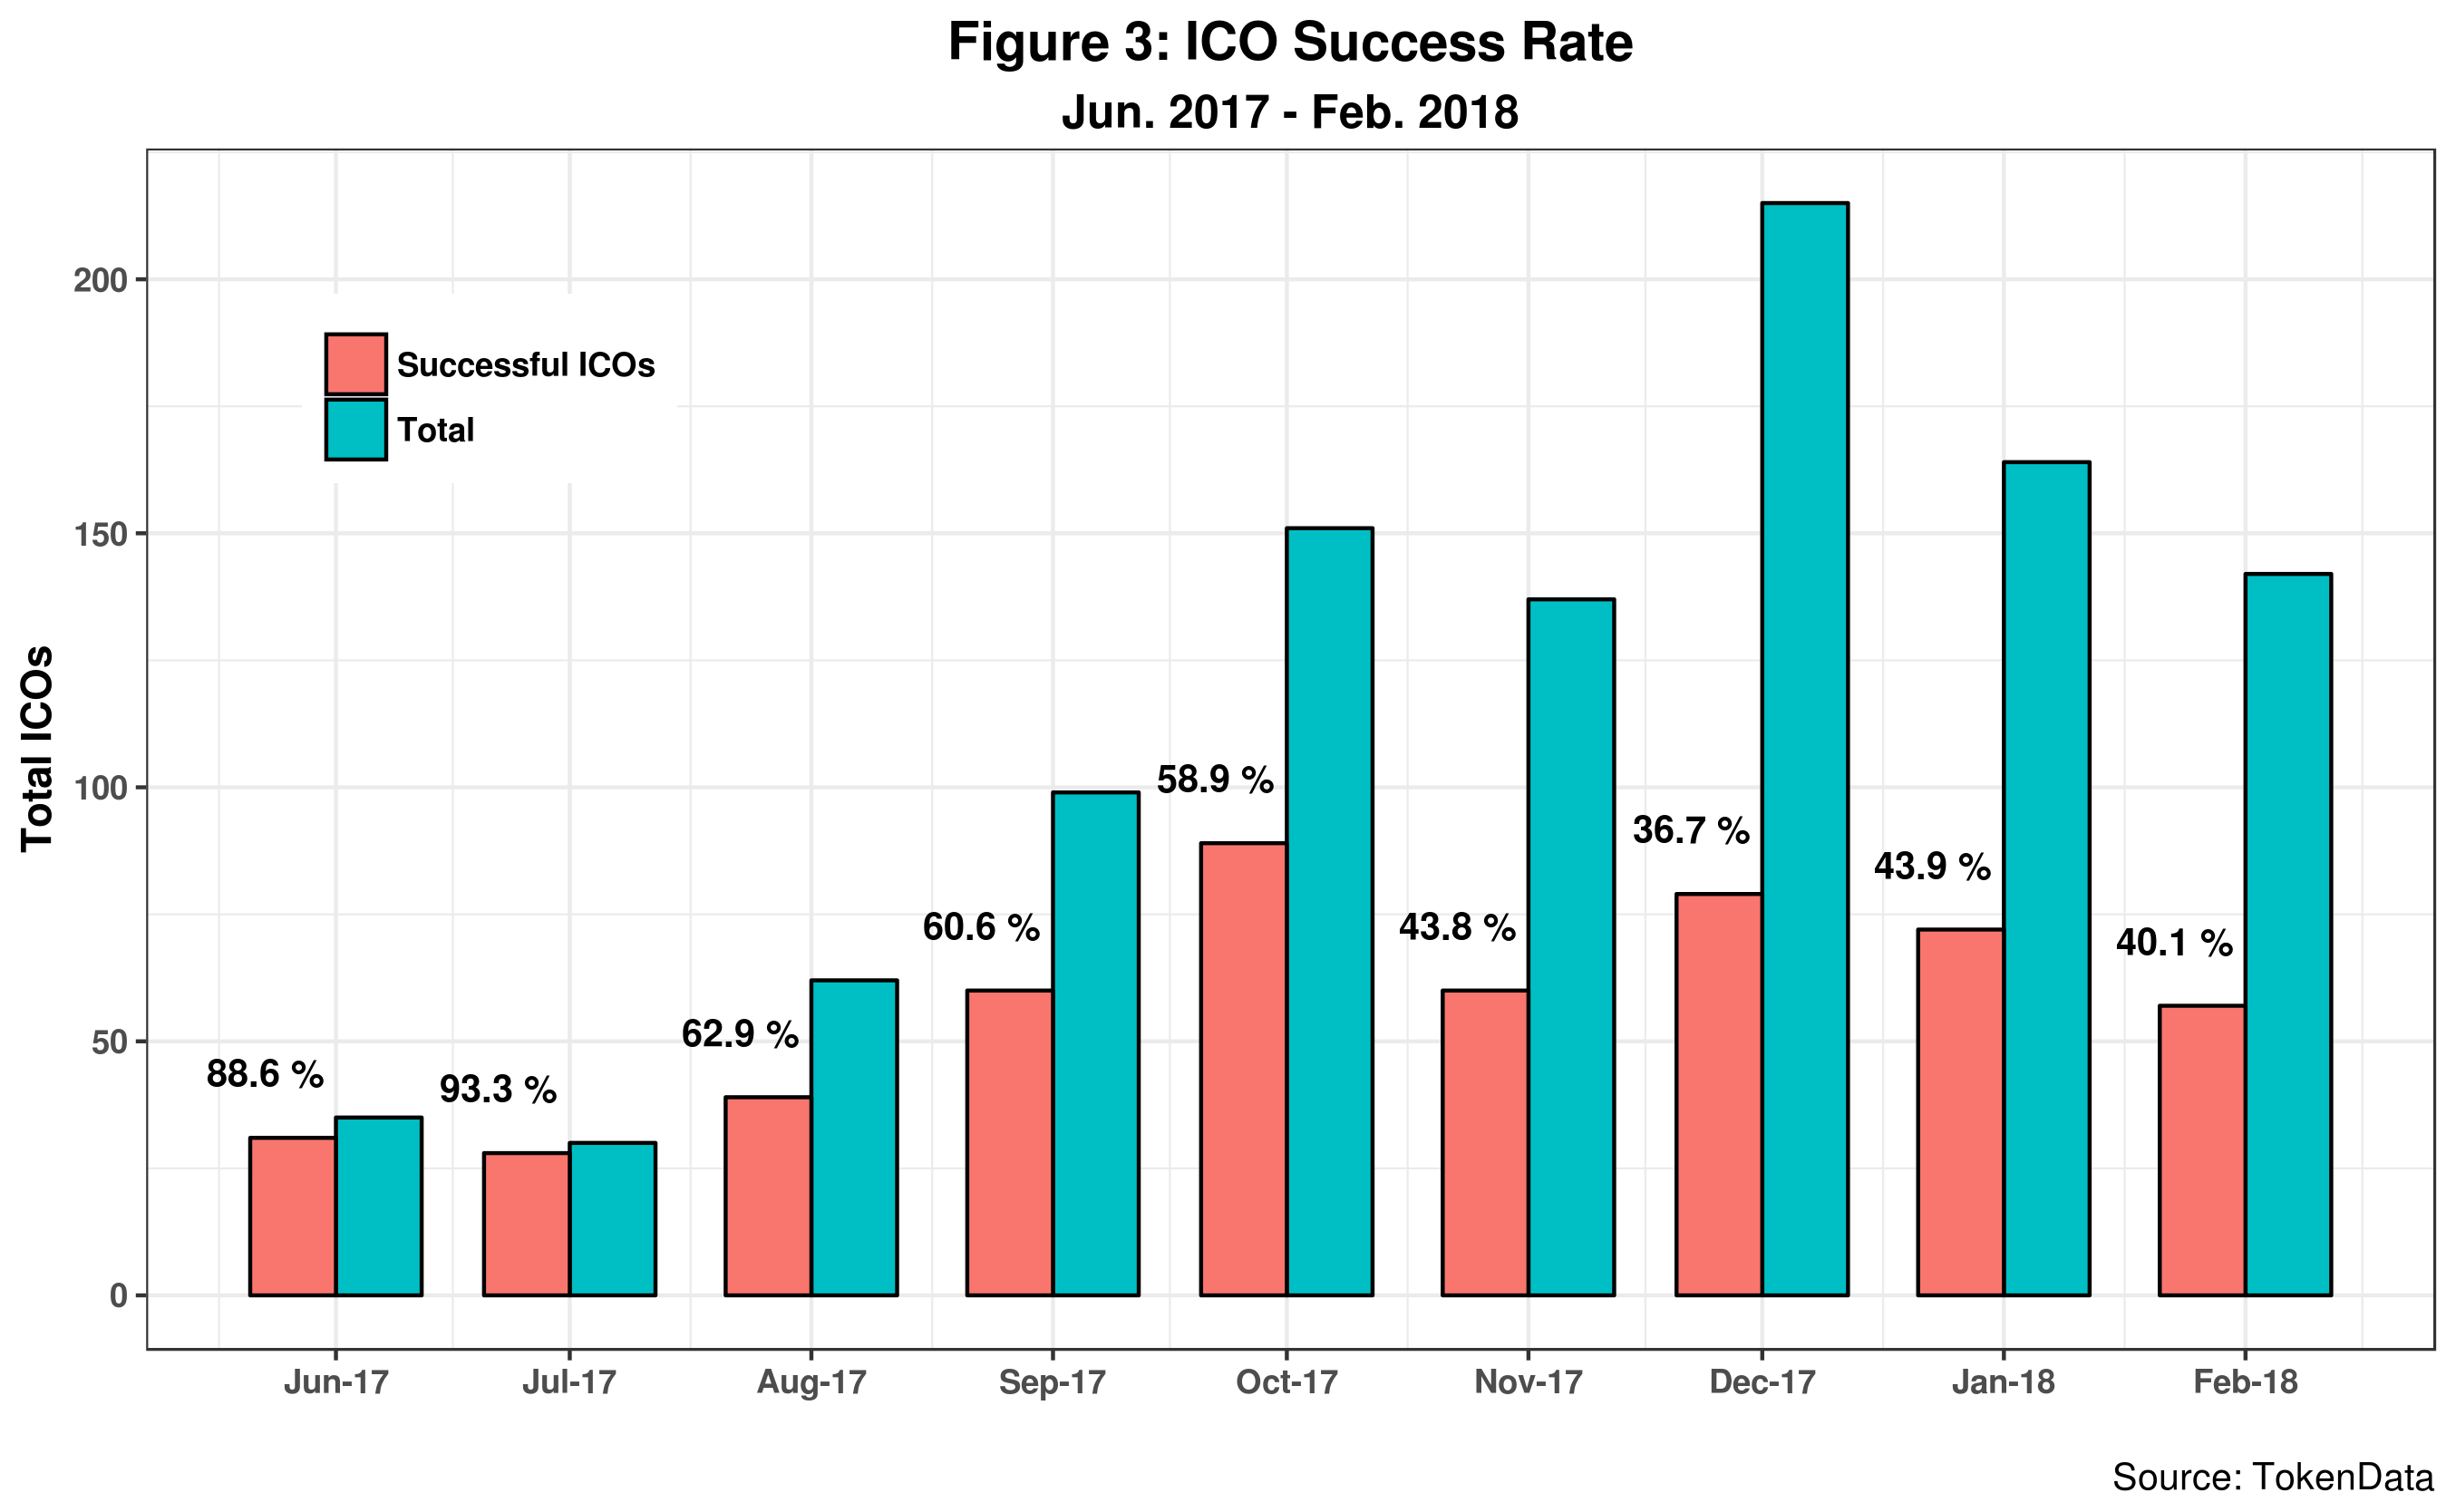
Even so, the median investment per ICO is still above 16 million dollars.1 The average is much higher but probably not significant as the statistical distribution of ICOs has long tails and thus include large outliers. The monthly success rate for ICOs is presented in figure 3.  Here, I have excluded from success all those ICOs that a) are reported as failures; b) report zero investment; c) report no data at all. And this is consistent for the months depicted in the graph so we can compare them. In any event, it should not be seen as a failure rate properly speaking. February reports one of the lowest success rates since the ICO boom started last year, ahead of December 2017.
These indicators altogether thus suggest that ICOs might not only be slowing down but also that risk might be increasing and investors are becoming more strategic before letting their capital fly away.
We will chek back next month.
Cheers, Raúl

Endnotes
| ⇧1 | The average is much higher but probably not significant as the statistical distribution of ICOs has long tails and thus include large outliers. |
|---|