Birth
Running on the coattails of the now infamous dot-com bubble, e-government first saw the light of day before the end of the last Millennium. At that time, where hype overtook the tech scene yet again, adding ‘e’ (as in electronic) to almost any theme became quite fashionable. First in the scene was e-commerce (and e-business) which foreshadowed the 1994 launching of Amazon, among others, followed by its successful IPO three years later. Surely, governments could also master the emerging digital technologies to improve their core functions while fostering increased efficiency, transparency, and accountability. Most governments in industrialized countries quickly jumped into the e-government wagon while emerging economies such as Estonia, Singapore, and South Korea were determined not to be left behind.
What about developing countries? By 2000, most were still struggling with securing a national Internet connection. Not surprisingly, the so-called digital divide dominated most discussions and ruled when it came to on the ground implementation. On the other hand, most of them had governments with varying degrees of functionality. In principle, e-government could thus be used as a carrot to entice developing country governments to invest in new ICTs – or at least prioritize them in the short-term. This was, in fact, the approach taken by the 2001 G-8 Dot Force Genoa Action Plan strongly supported by the Italian government who soon took the lead in this area. A year later, Italy officially launched the e-government for Development Program, creating a trust fund managed by UNDESA in New York. That same year, the UN published its very first report on e-government readiness.
Growing-up
Twenty or so years after its birth, e-government has also been a victim of conceptual disruption. This is perhaps best reflected on the various seemingly competitive terms that have emerged since. E-governance, connected government, transformational government, open government, smart government, and digital government are best examples here. While the degrees of separation among these remain open to discussion, nowadays the composite word e-government has lost most of its luster and is used less and less. No doubt smart or digital government sound more contemporary and thus more appealing to young people across the world. In spite of its relatively young age, e-government has become a dinosaur of sorts.
Not that these deems e-government irrelevant. Regardless of any preferred name, using digital technologies to modernize public institutions and improve the delivery of public information, goods and services remain at the core of most definitions of the concept. Engaging citizens and stakeholders in decision-making processes is a third core feature. The various competing ideas listed above usually tend to put the emphasis on one of these three features while either subsuming the other two under it – or simply ignoring them.
Developing
In any event, e-government and its many cousins continue to grow in the 21st Century. While different metrics are available, UNDESA’s e-government survey is the only one that has consistently published results on a bi-annual basis (on average) since 2002. The study also uses the same methodology throughout the years that allow data comparisons across time, notwithstanding changes introduced along the way. And finally, all reports use the same concept of e-government, which is broadly defined as the use of ICTs to deliver essential public services and information to the people. UNDESA’s version of digital government does not explicitly address institutional modernization and seems to assume that, by default, ICTs trigger such process. And the way the organization addresses stakeholder engagement and participation is limited as discussed below.
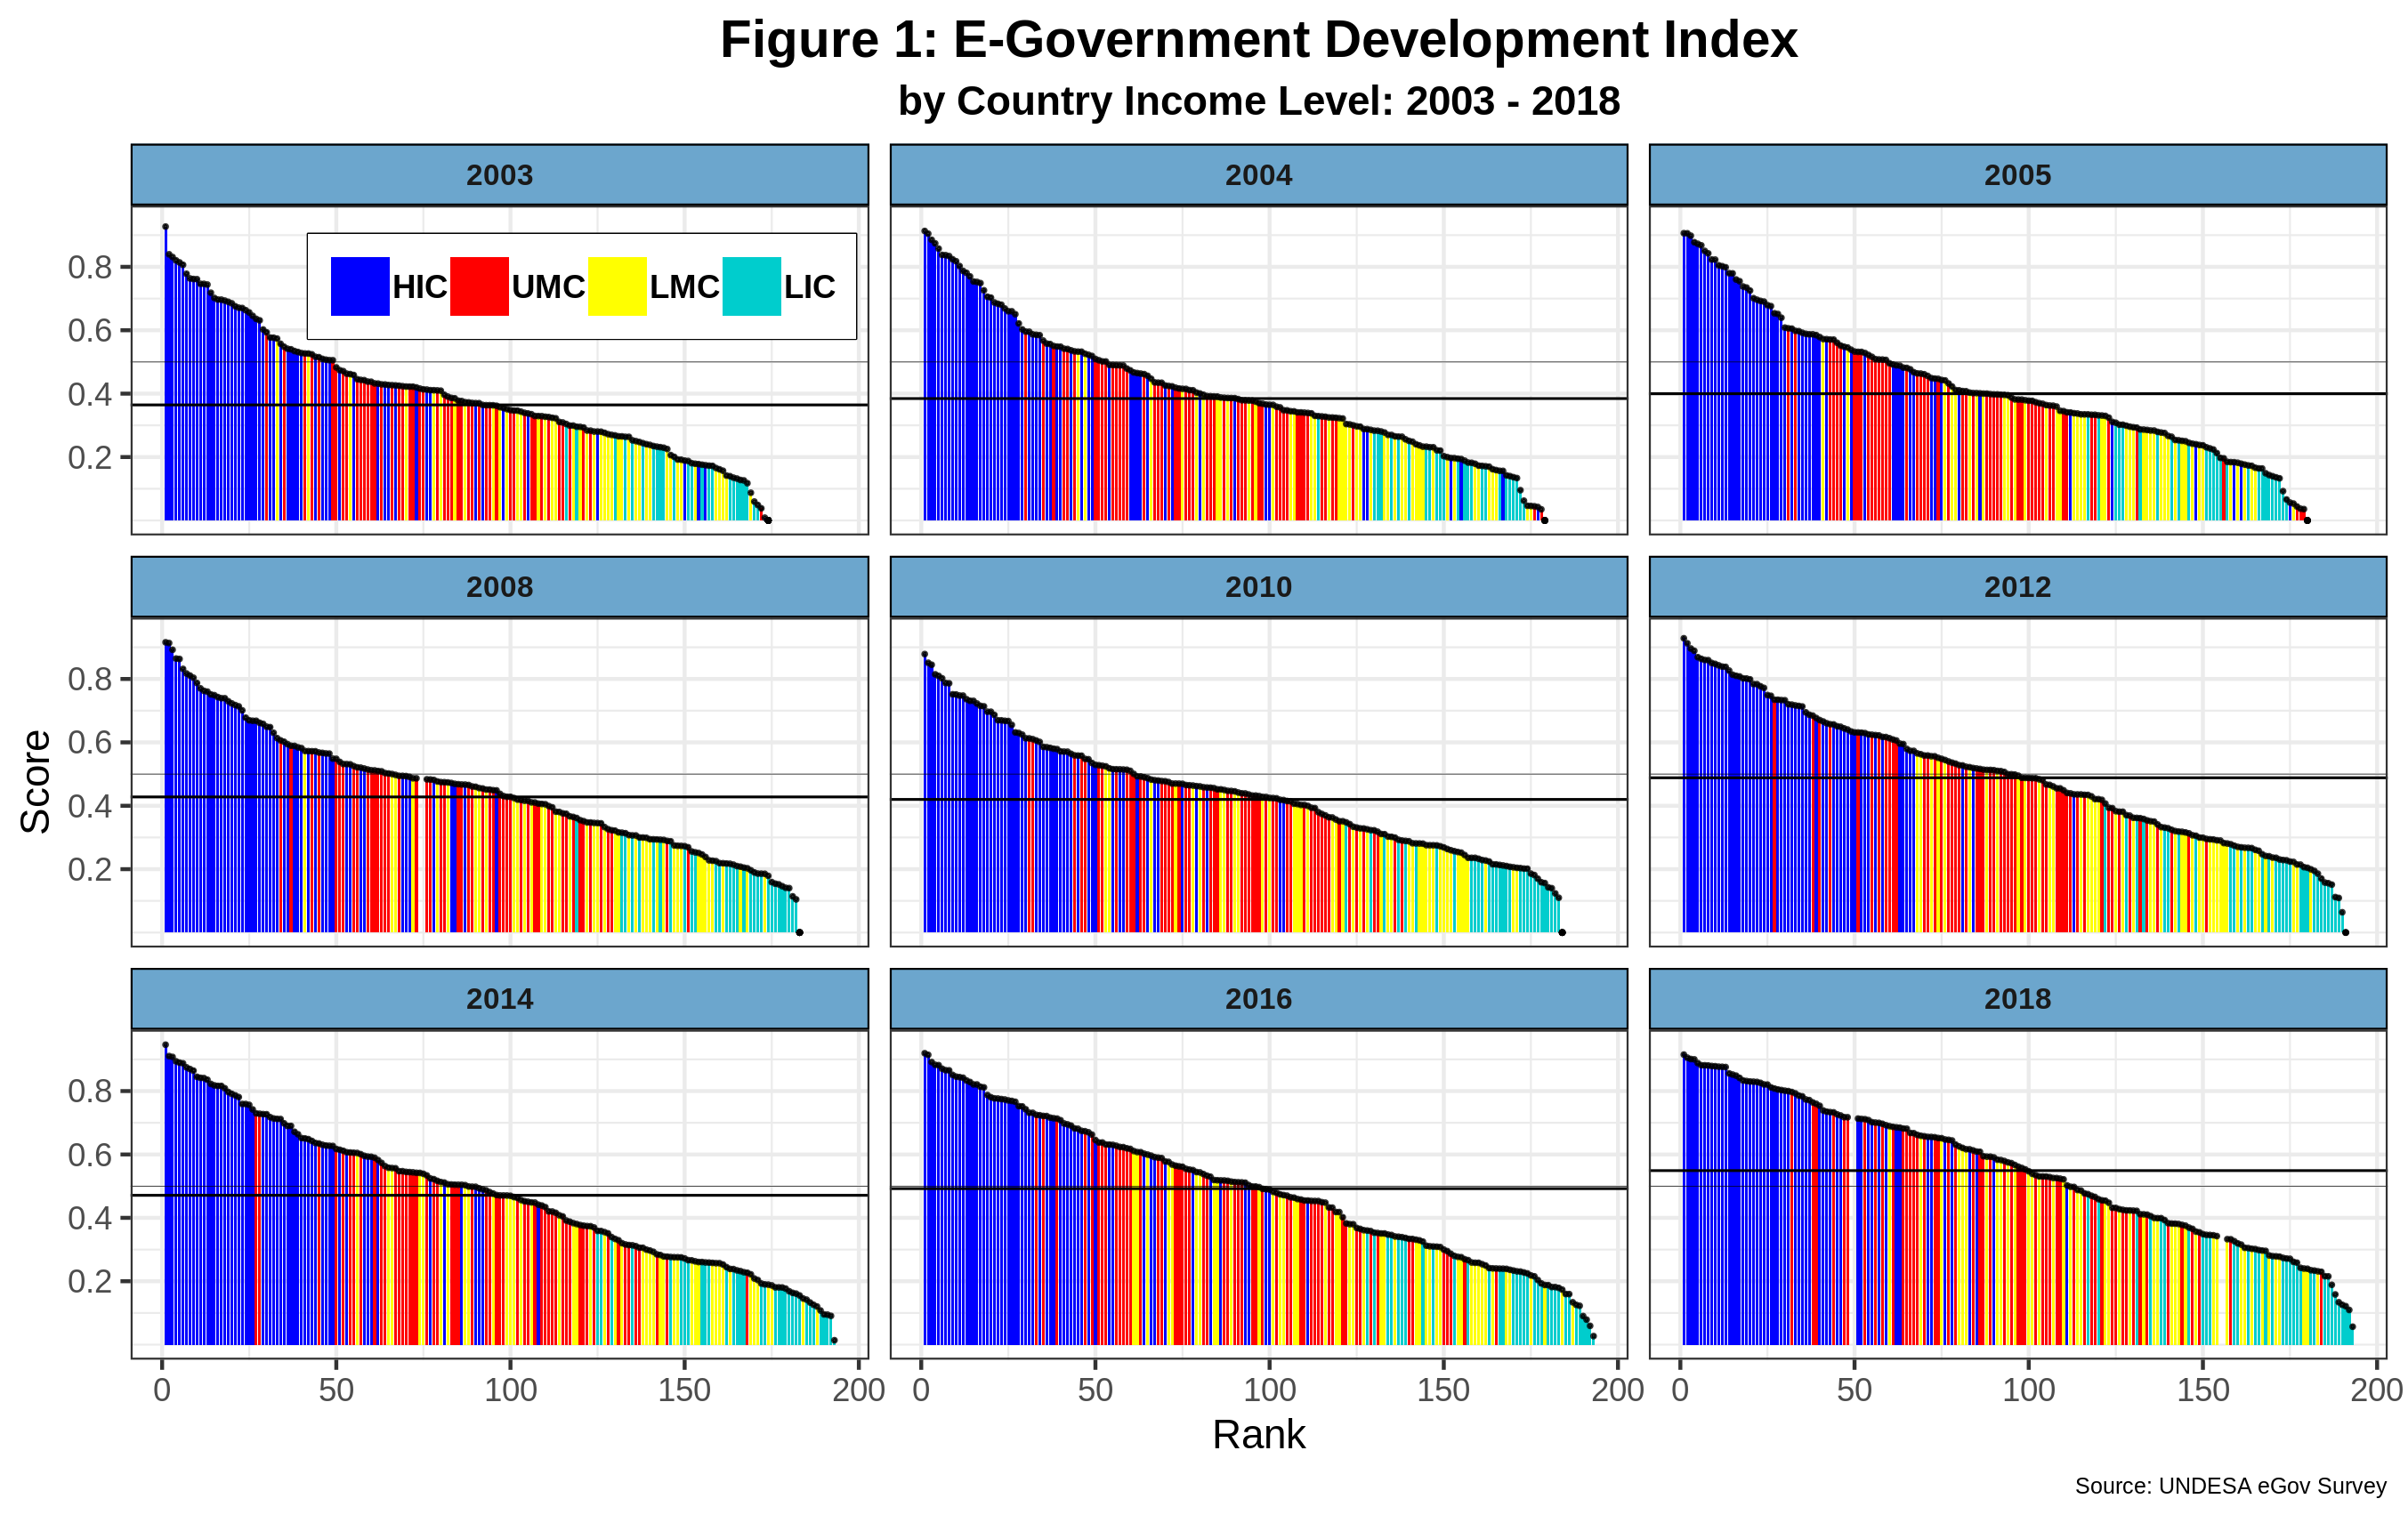
The e-government development index (EGDI) is the leading indicator produced by the organization. Note that the index is not supposed to be an absolute measurement of e-governments. Instead, it is a relative score that aims to show the differences among countries regarding the implementation of digital technologies by the public sector. Figure 1 below depicts the evolution of EGDI since 2003, countries covered classified by World Bank income categories.
 The horizontal dark line denotes the EDGI average score per year. As expected, there is a positive correlation between the EGDI score and country income levels. The correlation coefficient between the e-government index and GDP PPP per capita is 0.62, which, while healthy, still leaves room for countries to change their scores without corresponding changes happening in real income levels. This seems to be more relevant for countries with relatively low EGDI scores and GDPs. For example, several low-income countries (LIC) outperform those in the lower-middle income (LMIC) category. On the other hand, the 2016 and 2018 top 30 all play for the high-income team.
The average EGDI score has increased by almost 51% since 2003, breaking the 0.5 barrier for the first time in 2018. This suggests that most country e-government development indices have been progressively growing – with the notable exceptions of 2010 and 2014- which in turn reflects a higher uptake of digital technologies by most countries. Being a relative measure, the evolution of EGDI should show have a decreasing trend in the gaps between countries. Using the standard deviation per year as a proxy, this trend is hard to corroborate as such statistic reports a 1.7% reduction since 2003. In sum, while e-government continues to develop, average gaps between countries have remained constant with high-income countries running ahead of all others who, in turn, are having difficulties closing inter-country gaps.
Engaging
Since its inception, the e-participation index (EPI) has been a staple of the UNDESA e-government survey. The organization is well aware of the complexities of measuring the use of ICT to foster stakeholder engagement. In this light, the concept is limited to the supply side of the equation and thus only looks at what governments are doing to promote citizen engagement, mostly via the qualitative analysis of national government websites. The survey distinguishes three core e-participation features 1. Information sharing; 2. Consultation; and 3. Decision-making, which together are used to build the final EPI score. Figure 2 shows the EPI by country income levels, ranked by EGDI.
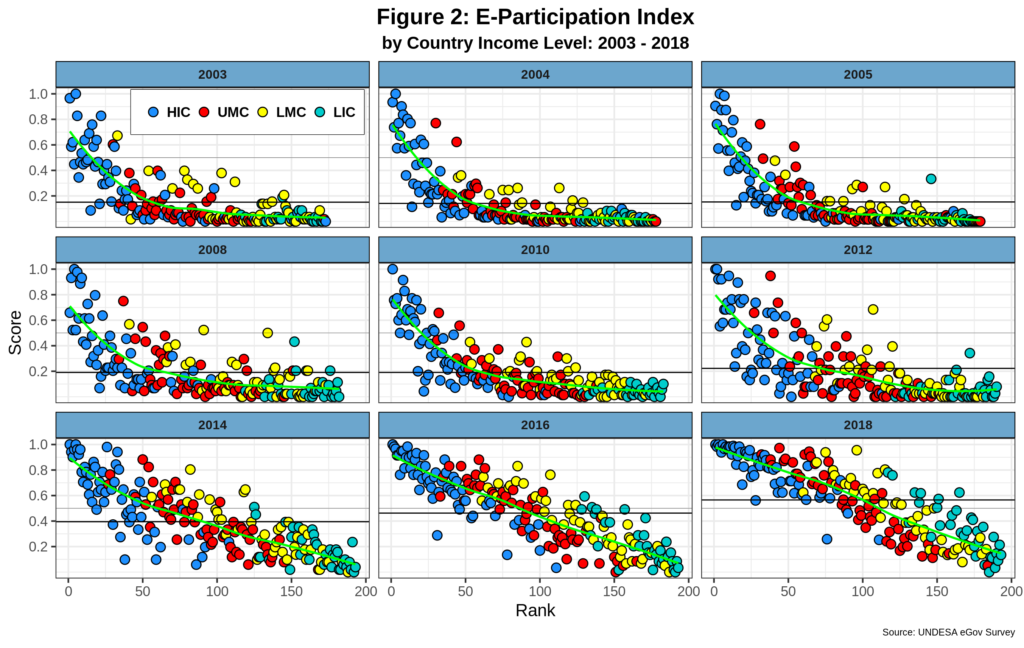
EPI has dramatically changed over the years. The first six data series clearly shows a humped L trend with most countries reporting shallow score levels – except for the vast majority of high-income countries. Starting in 2014, things began to pick up for most other countries, probably due to changes and improvements in the e-government and e-participation data collection and methodology. By 2018 the EPI overall trend was already linear. While a clear association between EPI and country income levels can be intuitively detected in the graph, the correlation coefficient is much lower than that for EGDI, standing at 0.42. GDP per capita thus plays a lesser role here. Note for example, that in both 2016 and 2018 countries from all income levels have EPI’s above the average while a few high-income nations are well below the overall mean score.
Starting in 2014, the average EPI has been subject to high inflation. It jumped from 0.222 in 2012 to 0.395 in 2014. By 2018, it had reached 0.565 for a gain of 42.2% in the last 4 years. Comparatively, EGDI only grew 16.6 in that same period. EPI is also presented by the survey as a relative measure. However, and unlike EGDI, its standard deviation has actually increased by 7.5%, suggesting that average gaps among countries are gaining ground, not decreasing over time.
EGDI and EDI are thus walking in different paths, which is surprising as data collected for their estimation comes from the same sources. Recall also our overarching definition of e-government where citizen engagement is one of its three core pillars and should thus work in sync if e-government is to progress in the medium term. Part of the issue here stems from the fact EDI is measured via the qualitative assessment of government websites and is thus supply-side centered. But assessing sophisticated forms of e-participation such as decision-making do need to factor in the demand side too. Otherwise, governments can create a plethora of e-participation sites to increase EDI scores, while real stakeholder engagement is minimal or, in extreme cases, even mandatory.
In the next post, I will explore the various components of these indices as well as the relation between e-government and political regimes.
Cheers, Raúl
