A paper on the subject published a couple of weeks ago in the academic journal Psychological Science attracted plenty of attention thanks to some of its surprising conclusions.1 The paper is behind a paywall. Its main finding is that, contrary to all expectations, there is an inverse relation between gender equality and the number of women that graduate in Science, Technology, Engineering and Science (STEM). That is, higher gender-equality is correlated to lower female graduation rates in STEM. And vice-versa. How can this be?
In this post, I will explore the issue in more detail. First, I take a quick glance at the data used by the researchers. I then explore some of the nuances of the WEF’s Global Gender Gap Index (GGGI) used to measure gender equality. I conclude with some possible alternatives that could explain such paradox.
Data
The research used multiple data sources, two of which play a vital role in the analysis. The first one is the WEF gender index mentioned above and published annually since 2005. The latest version was released last November and covers 144 countries.2 The number of countries included in the index has been steadily increasing over time. UNESCO’s UIS.Stat data is the second source. This package contains data and indicators on education, science, and technology among a few others. It covers over 200 countries, but not all have the same information. For education, the latest data available is from 2016 but is limited to a few countries. I thus used 2015 data for my analysis. Note that the paper used earlier versions of the data. But as we will see this does not alter its primary finding.
The Global Gender Gap Index
The GGGI is calculated as the unweighted average of four subindices, namely 1. Economic participation and opportunity. 2. Educational attainment. 3. Health and survival. And 4. Political empowerment. Each subindex is computed using two or more indicators, each receiving a specific weight. Of particular interest to us is the education subindex which includes enrolment rates for primary, secondary and tertiary education, in addition to overall literacy. Note that the tertiary gross enrolment indicator receives a weight of just over 12 percent in the final education attainment subindex computation.
One of the critical traits of the GGGI is its focus on gaps and not levels. In other words, it measures the gender gap regardless of the overall level of development. For example, in the case of tertiary education, the indicator is estimated as the ratio of women to men enrolled – and not to the total in the sector. It is thus a relative ratio. This allows the subindex to capture the actual gender gap, regardless of the level of development within a given country. This distinction between gap and level will be crucial to understanding the scope of the gender-equality paradox. Note also that the GGGI explicitly truncates indicators that are greater than 1 – which is the case when women are ahead of men – and rounds them up to 1. While this does raise some issues which we cannot discuss here, it is also an essential consideration for the analysis of the gender-equality paradox.
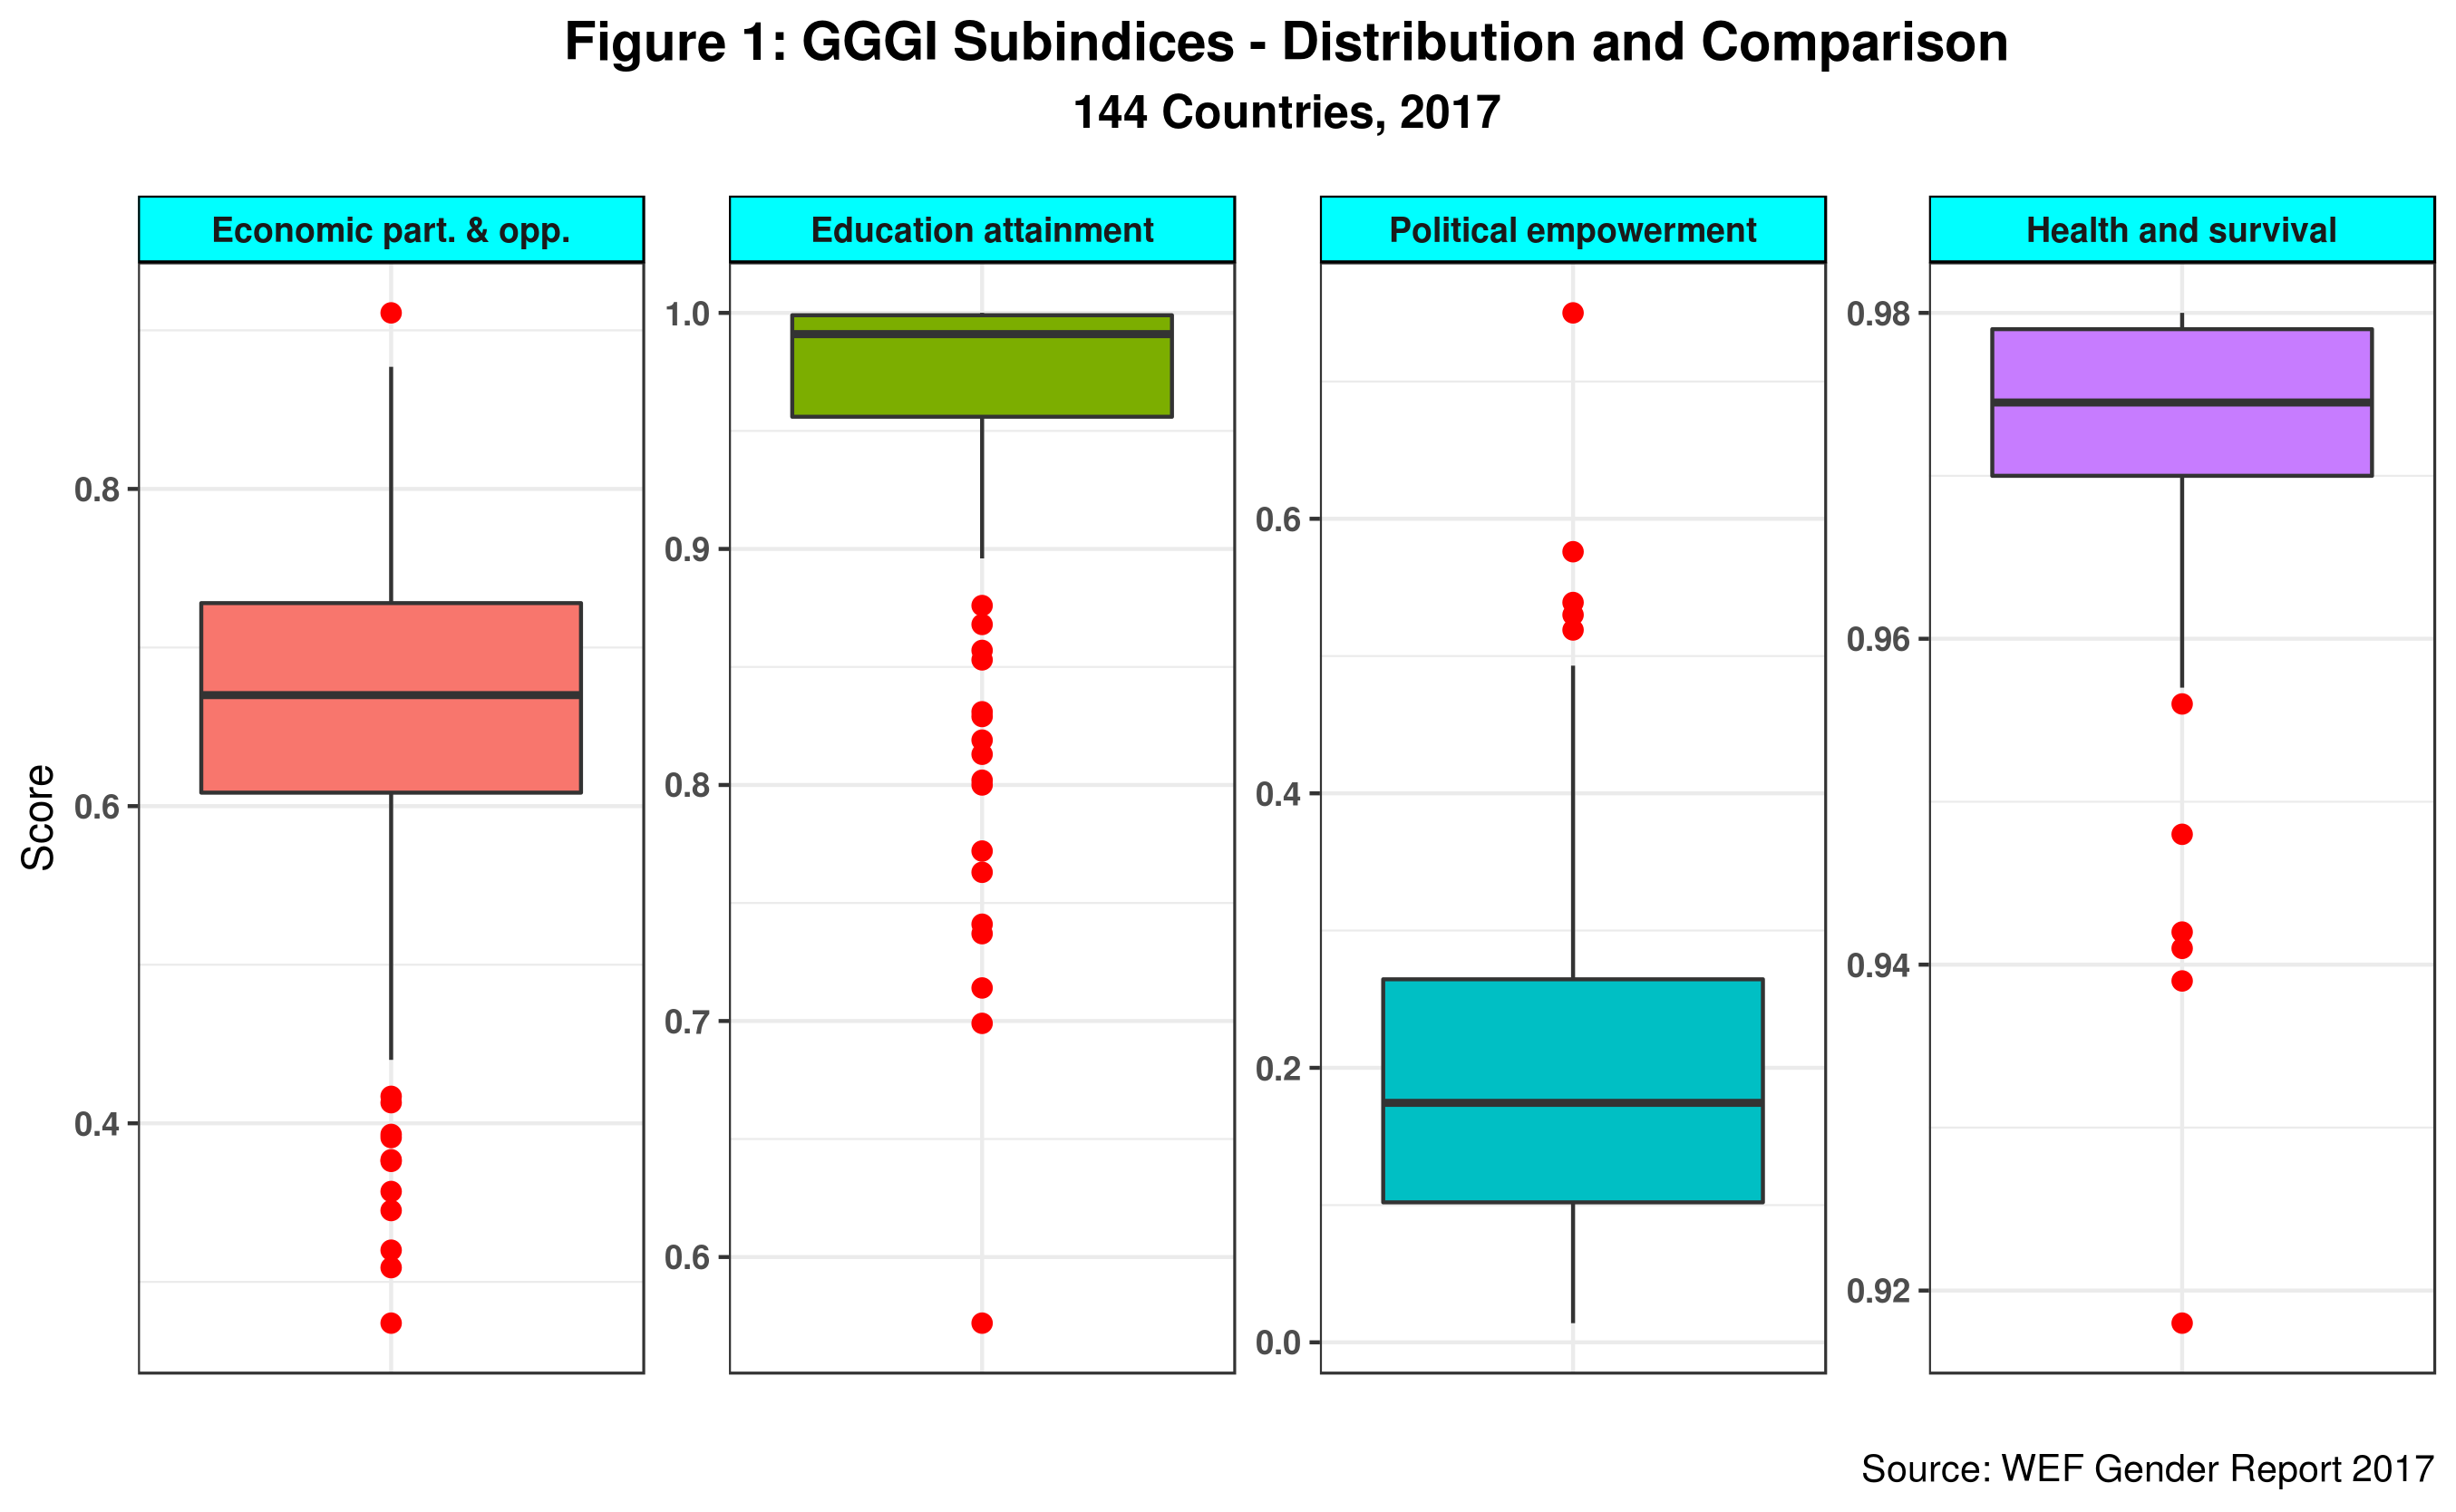
Figure 1 shows the statistical distribution for each of the four GGGI subindices as well as their levels vis-a-vis each other.

The bold line inside each rectangle is the median value for each subindex. The box captures the middle 50 percent of all countries (between 25 and 75 percent) while the red dots depict outliers. Note that both education and health have very high scores while political empowerment is the worse performer. Economic opportunity is sort of middle of the road. This implies that countries having relatively small gender gaps in both health and education can still have high gender inequality (or lower GGGI score) due to lack of economic opportunity and political empowerment for women. This could certainly explain in part the so-called paradox. But wait, things are a tiny bit more complicated.
Looking closer at the education subindex we note that 80 countries score of at least .990. And within this group, close to 30 report a score of 1, meaning there is no gender gap in education at the current levels. At the same time, some of those countries show evident gaps in female STEM graduation, as the paradox paper shows. And, as we saw before, gross enrollment in tertiary education accounts for 12% of the education subindex. What is going on here?
The Paradox revisited
Figure 2 reproduces the best-known graph presented in the paper. As mentioned, I am using the latest data available so while country names and specific numbers might not match the original, the key trend identified in the paper does hold.
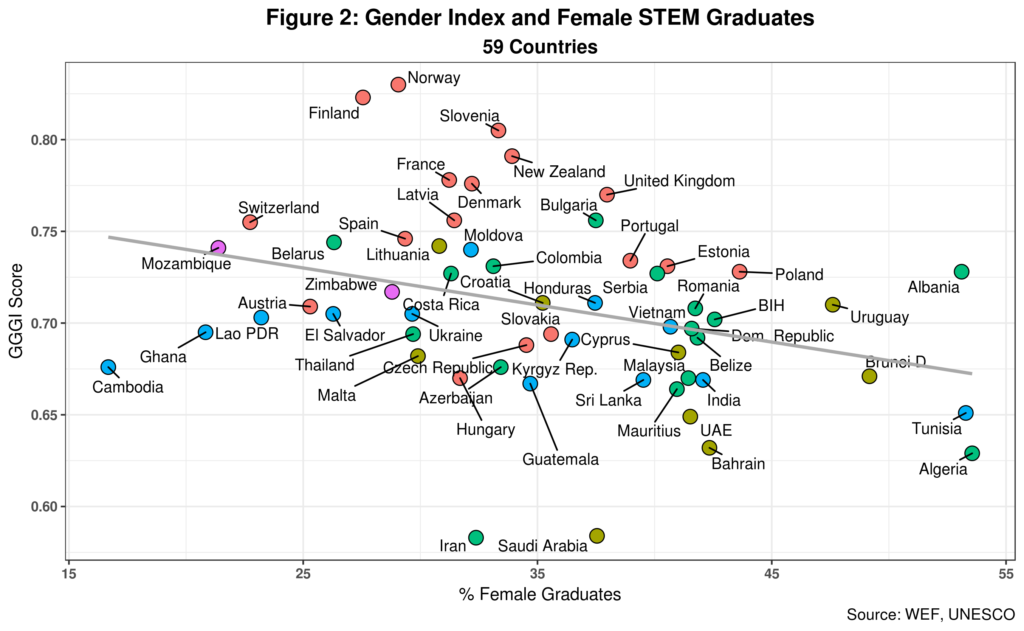
For starters, note that only 59 countries out of the 144 in the GGGI report have STEM graduate data available. That is just over 40% of the total, a low ratio that in principle could introduce some statistical bias, especially if the most impoverished countries where gender gaps tend to be larger are not part of the equation. In any case, the correlation between GGGI and the percentage of females graduating in STEM is negative 0.326 as the regression line in the graph suggests. Given the sample size, the probability of such correlation being statistically significant is low, however. Even so, this result is indeed counterintuitive.
UNESCO data reports ratios for 11 tertiary education areas, as well as indicators aggregated by both STEM and non-STEM areas.3 Data, however, is not available for all countries. In some cases a proxy for STEM has to be used, as is the case for 2014 data for example. Similar to STEM, the tertiary education areas of Arts and Humanities and Services also report negative correlations with the GGGI.4 Correlations coefficients are smaller compared to that of STEM which suggests little to no statistical significance. The paradox thus does not seem to be limited to STEM. It also includes a couple of non-STEM areas. So the plot thickens.
Not that this is visible in Figure 3 where I graph the GGGI vs. female non-STEM graduates.
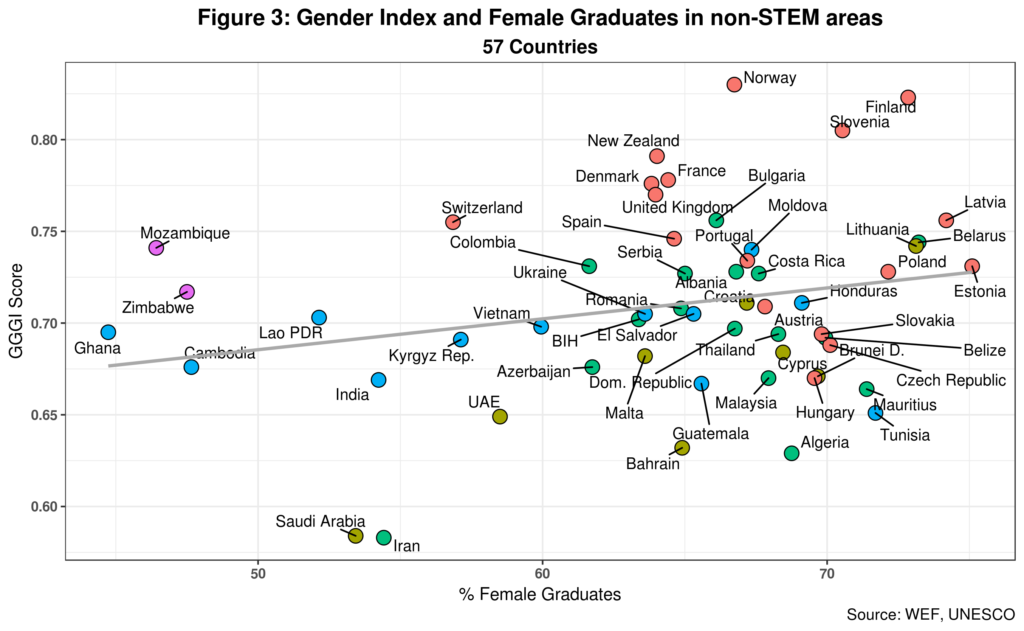 As expected, we find a positive but weak correlation (0.242) between the two. Most countries in the sample are on the right-hand side of the graph thus leaning towards smaller gender gaps in non-STEM areas. If anything, we might conclude that the GGGI is not correlated with the smaller gender gaps that characterize female graduation rates in non-STEM careers. Note also that countries with lower GGGI such as Tunisia and Algeria are ahead of countries such as Norway and Denmark which are at the top of GGGI rankings. We thus find a non-STEM paradox that also demands an explanation – although this one is undoubtedly less acute.
This seems to suggest that there are some additional factors behind these trends. The paper proposes one possible explanation. But they might be others.
I will explore them in my next post.
Cheers, Raúl

Endnotes
| ⇧1 | The paper is behind a paywall. |
|---|---|
| ⇧2 | The number of countries included in the index has been steadily increasing over time. |
| ⇧3 | Data, however, is not available for all countries. In some cases a proxy for STEM has to be used, as is the case for 2014 data for example. |
| ⇧4 | Correlations coefficients are smaller compared to that of STEM which suggests little to no statistical significance. |
Comments
One response to “Deconstructing the Gender-Equality Paradox in STEM”