In the previous post of this series, I was surprised to uncover the lack of a positive correlation between GIRAI and regime types—as defined by The Economist Democracy Index (EDI). I expected the opposite since GIRAI’s design is driven by a human rights agenda. That is, countries with democratic regimes should achieve higher GIRAI scores. The fact that most countries do not report any data for most of the 19 index dimensions partly explains the situation. However, the issue is more complex as it is directly connected to state capacity, a dimension often ignored in digital technology research and analysis. As I have argued before, high-state capacity is relatively independent of political regimes. In other words, we can find powerful states in both democratic and authoritarian regimes. We should thus not associate state capacity with a specific regime type (autocratic).
In principle, the three core GIRAI pillars, government frameworks (Gf), government actions (Ga) and non-state actors (NSA), can be used as proxies for state capacity and regime type. Since both Gf and Ga are heavily dependent on the capacity of governmental institutions and associated governance mechanisms, they are indeed closely linked to state capacity. However, another issue with GIRAI’s data is the high multicollinearity between Gf and Ga, which is probably the result of severe theoretical and practical overlap between the two. Indeed, their correlation coefficient in the large data set is 0.97. To avoid the issue, I have computed the mean values for the two. A simple regression between the average G score and EDI’s government function indicator indicates a strong association at the 99.9 level, suggesting that state capacity plays a central role. On the other hand, regressing NSA against the five EDI indicators only shows statistically significant links to EDI’s government function indicator only. All others that capture the political side of the equation are not relevant. So here again, state capacity is at play.
Next, I will focus on the relationship between GIRAI scores and GDP per capita, the UN e-Government Index and the ITU ICT Development Index (IDI). The figure below depicts index scores face-to-face with 2023 GDP per person by region (click on graph to enlarge).
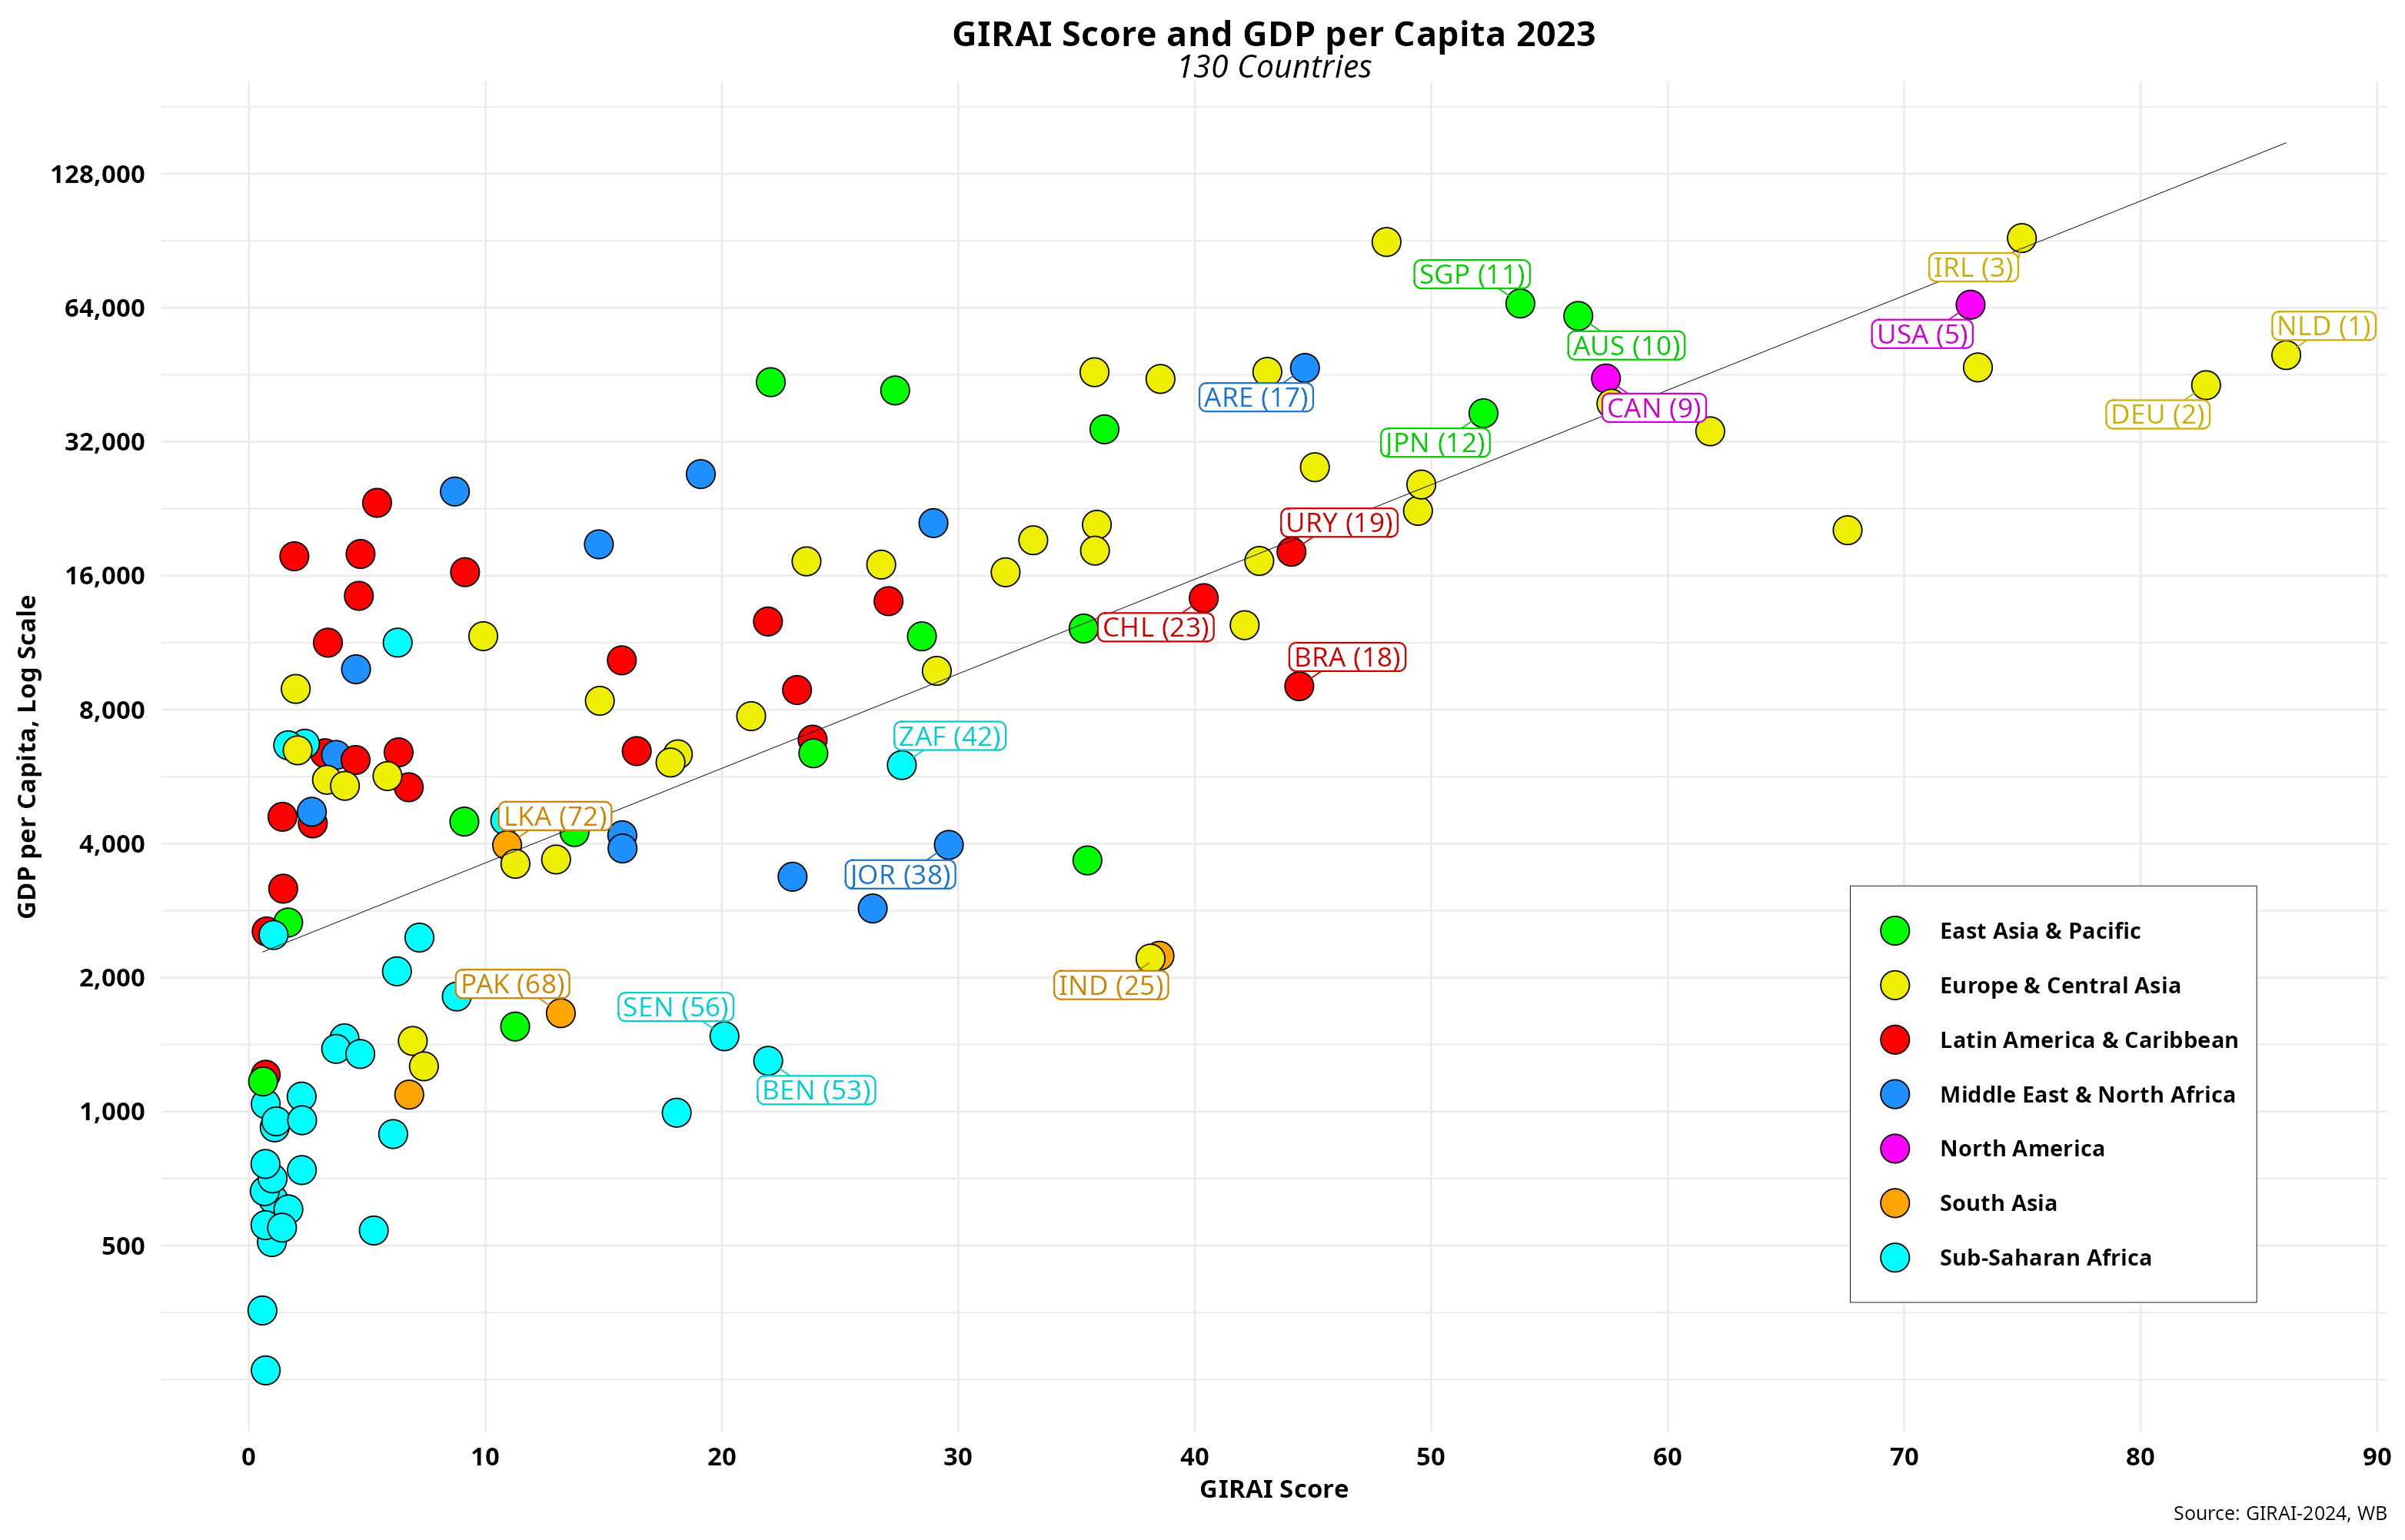
The top three countries per region and their corresponding GIRAI score ranking are highlighted. The thin black ascending line shows the regression fit for 130 countries, as GDP 2023 data for some countries is unavailable. A strong correlation between GDP and GIRAI exists, especially for countries above scores of 20 and GDP over 2,000 USD. Most countries in Sub-Saharan Africa with scores below ten do not follow the same pattern, while LAC and MENA are more of a mixed bag, with some performing very well and the rest lagging far behind. Looking closer at income levels, we can see that high-income countries (income > $13,850) tend to move in sync with GIRAI scores, but that correlation decreases substantially as we move down the income ladder. For LICs (< 1,135), there is certainly little correlation. A simple regression model confirms such a result, noting that LMICs are slightly ahead of UMICs regarding GIRAI scores.
The figure below links index scores to the UN e-government development index. Once again, the top three countries by region are highlighted, including their respective GIRAI score ranking. I have fitted a polynomial regression line to capture the apparent non-linear association between the two.
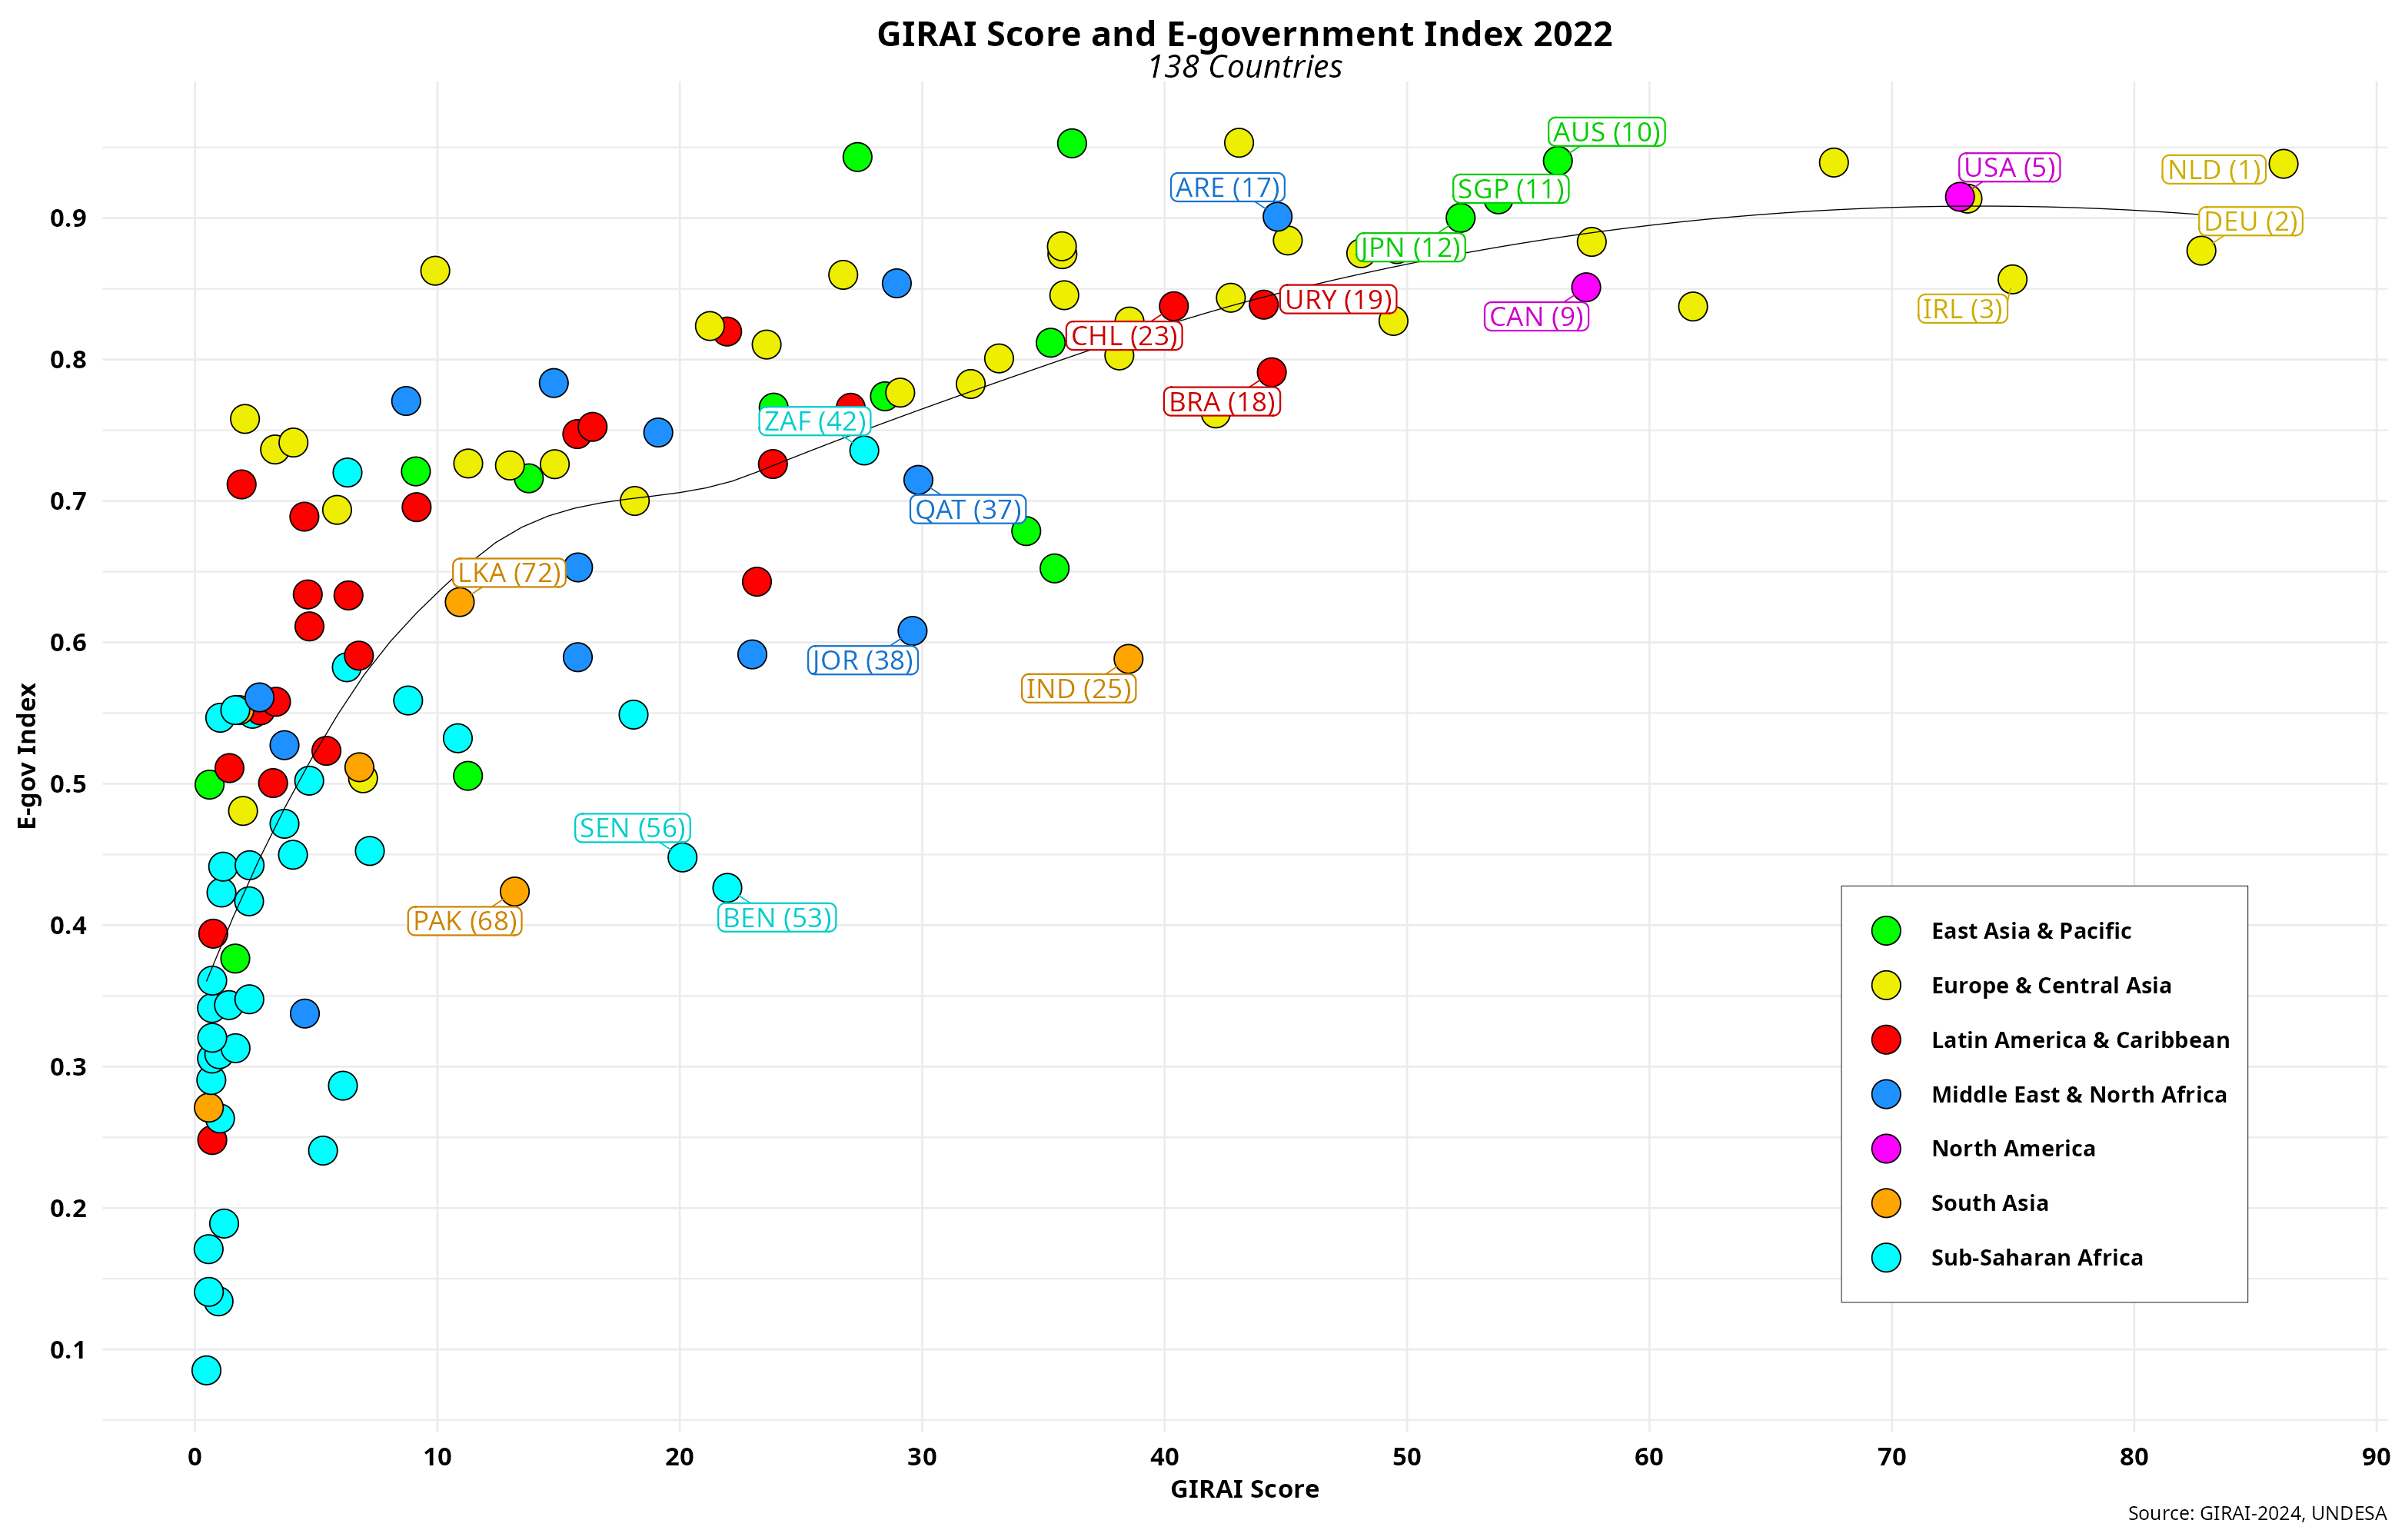
The results are strikingly similar to index scores and GDP/cap. Here, the correlation between the two takes off for scores over 15 and e-government indices above 0.06. But there are a bunch of countries on the left side of the chart that seem immune to GIRAI score variations. Most of these are in Sub-Saharan Africa and LAC, yet again. Nevertheless, the correlation between the two is almost 0.75. However, no correlation exists between region and GIRAI scores except for North America, which only includes two countries and is thus not statistically relevant. Finally, several top e-government performers (scores higher than 0.8) are not part of the leading GIRAI team, but most GIRAI leaders have a strong e-government presence.
ITU’s IDI is essentially a connectivity index that measures the level of infrastructure development and its usage by local populations. The figure below showcases its dynamics vis-à-vis GIRAI scores using the same regional configuration above.
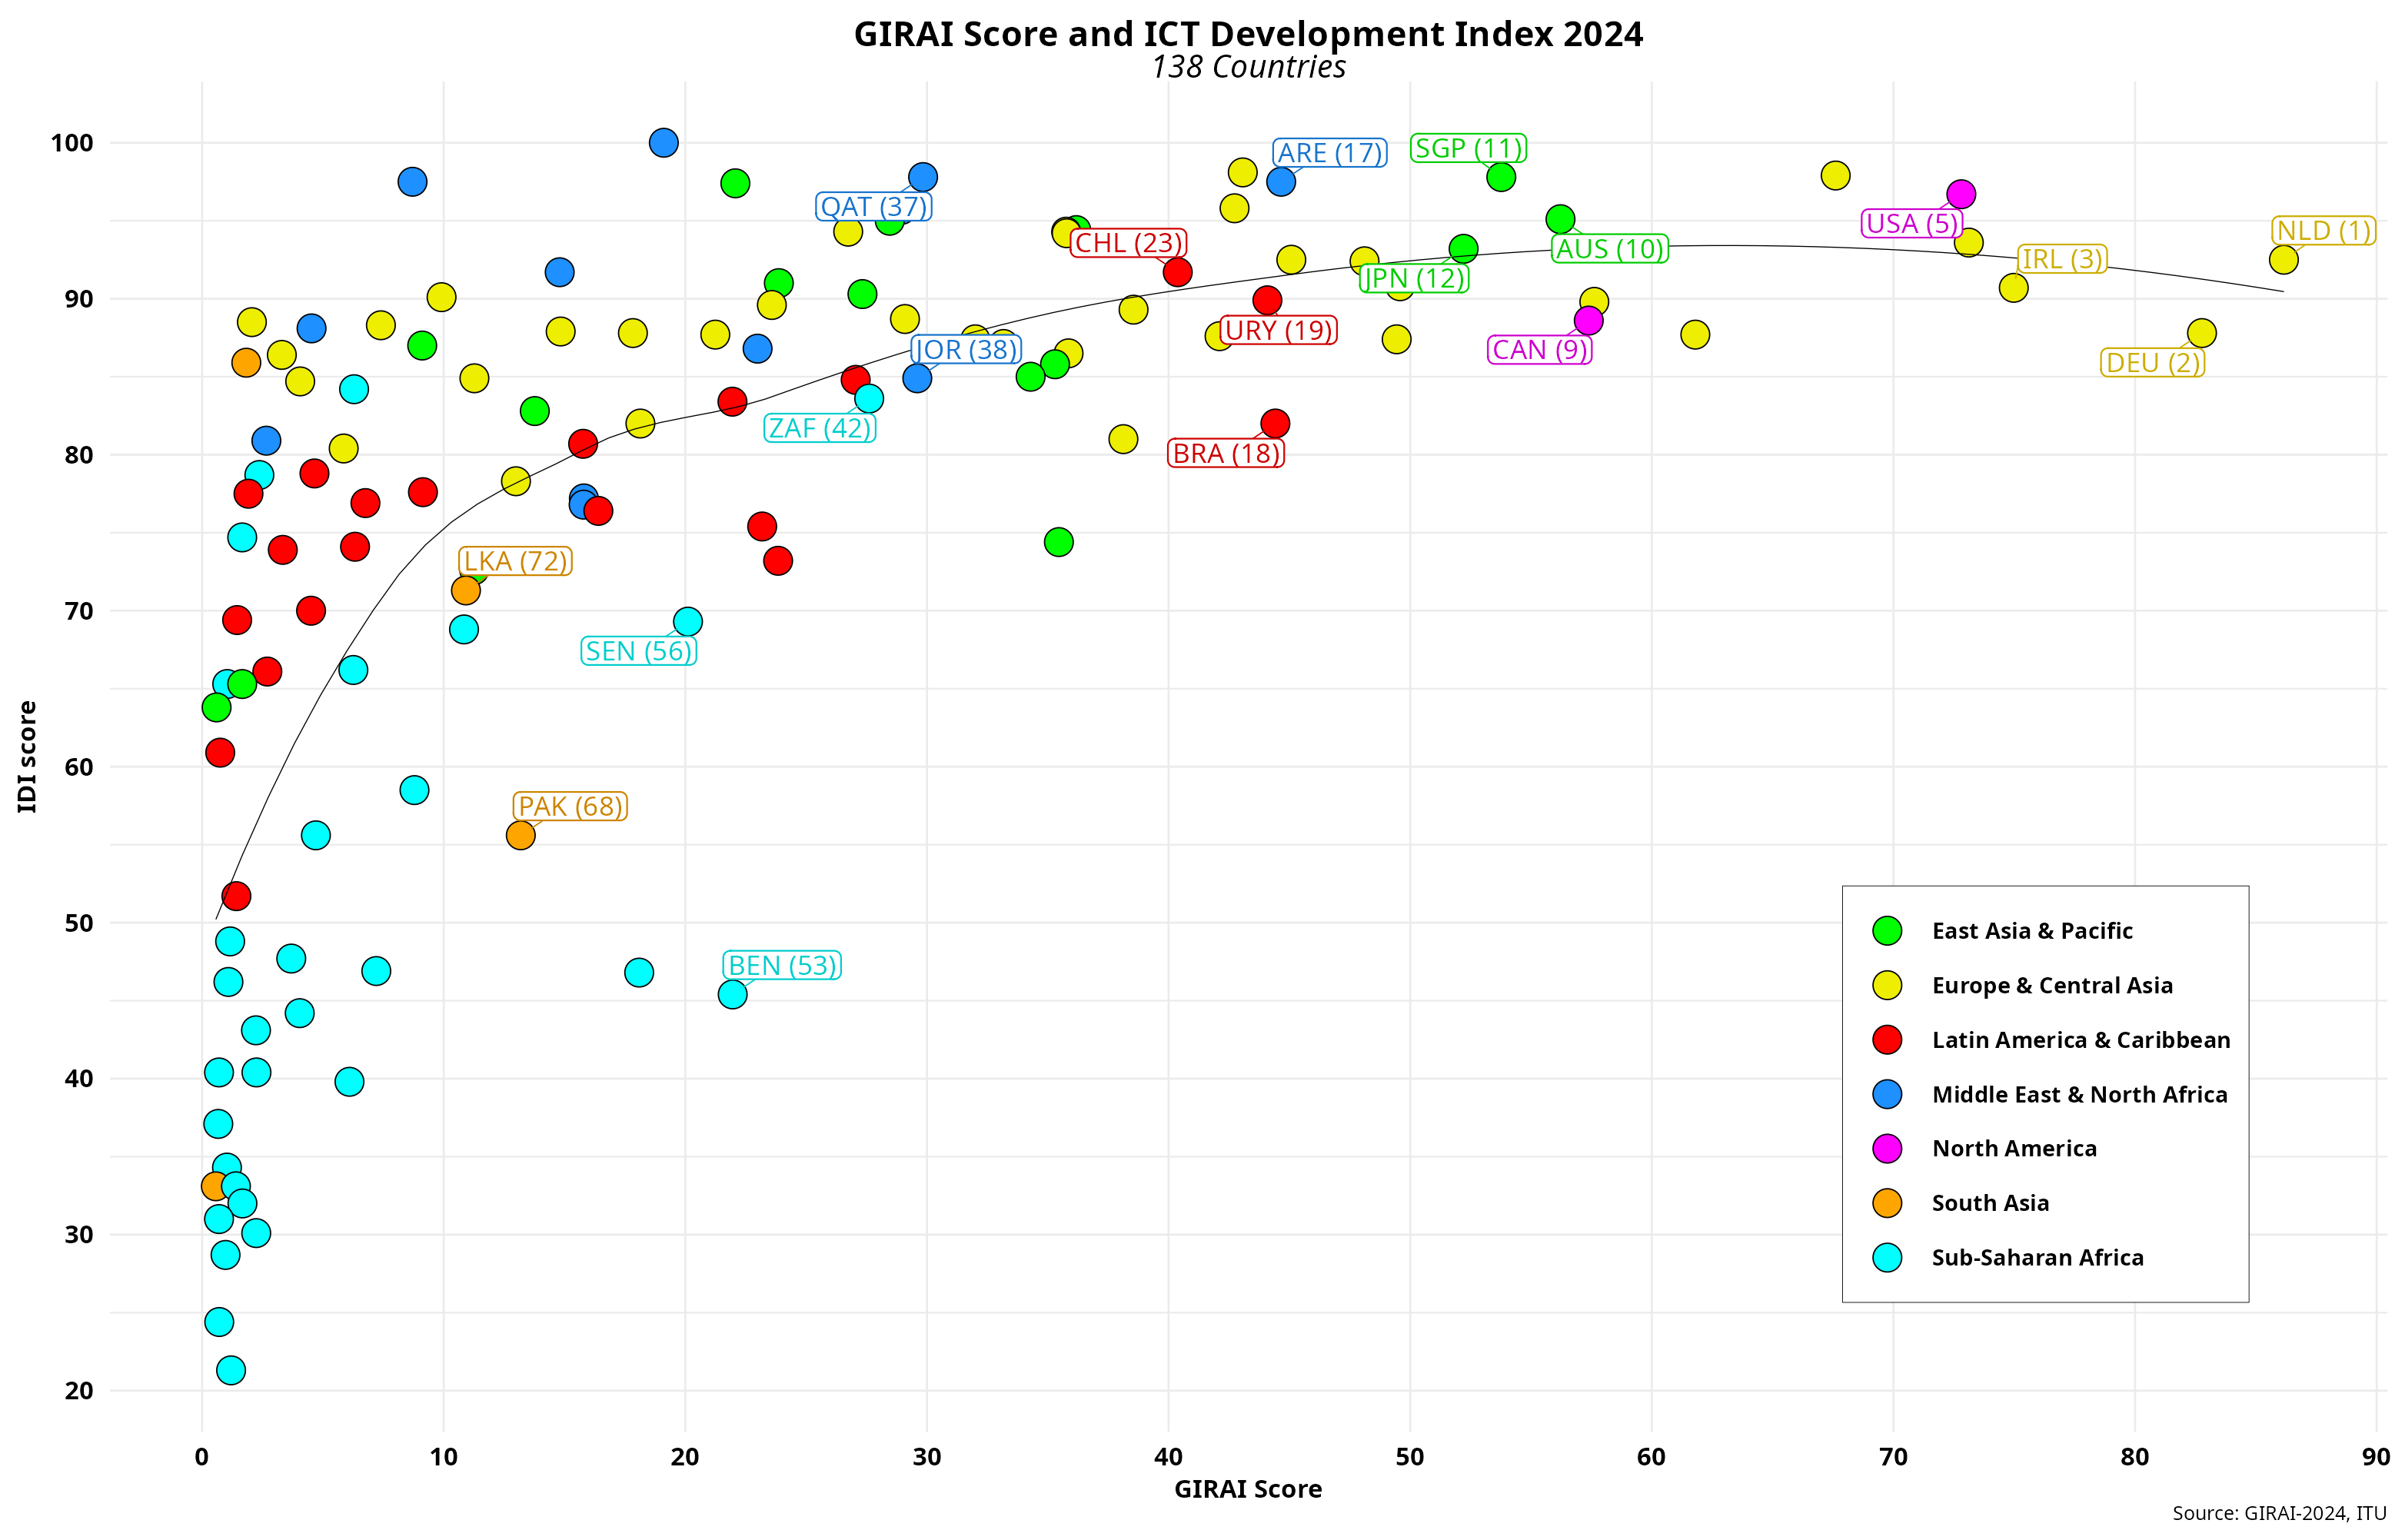
Again, we see similar patterns to those in the previous two figures. The big difference here is that many more countries have relatively high scores (IDI > 75), regardless of region. But quite a few of them, including IDI leader Kuwait, score poorly regarding GIRAI. As a result, the correlation between the two is lower than that of GDP/cap and e-government, barely reaching 0.60. We can then conclude that while infrastructure development and use do not guarantee AI development automagically, AI development does require the former to take off systematically. Measuring as part of an AI index is thus critical.
In any event, the similarities between the three independent indices and GIRAI raise a few questions that demand additional research. As an appetizer, I ran a regression model using these three, in addition to the democracy index. The results are shown below.
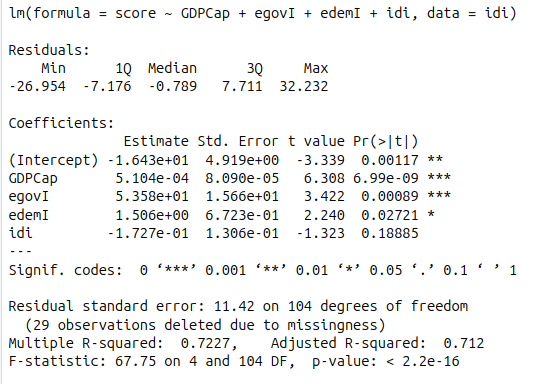
While IDI is statistically insignificant with a negative coefficient, only GDP per capita and the e-government index are significant. And the democracy index is struggling to become an essential player in the model. That could be very disappointing for an index that strives to enshrine all human rights as its core strategic target.
Raúl
