Artificial Intelligence (AI), including its siblings machine learning and deep learning, has grown by leaps and bounds in the last decade. More importantly, the technology has been deployed effectively in a wide range of traditional sectors, bringing real transformational change while raising fundamental socio-economic (joblessness, inequality, etc.) and ethical (bias, discrimination, etc.) issues. Today, AI, understood as a set of still-evolving technologies, seems poised to become a general-purpose technology that could leave no stone untouched.
Like other digital technologies, most developing countries face the daunting challenge of harnessing AI to foster national human development. Prima facie, AI looks mostly like software, code that one can even download from the web for free, thus not requiring massive capital investments for practical use. While true, AI depends on four interconnected technologies: 1. High computing power. 2. Fast and reliable network connectivity. 3. Big data. And 4. Vast storage capacity. And most demand a substantial investment of financial resources. Indeed, most developing countries cannot claim they already have a technology ecosystem prone to AI diffusion – not to mention glaring policy, human (including AI expertise), and institutional capacity gaps, among others.
So, how can governments in this set of countries get the ball rolling?
A government AI readiness index (GAIRI) could be handy here. The idea of measuring readiness regarding digital technologies is certainly not new. Recall that the Network Readiness Index, spearheaded by Harvard, was first published in the early 2000s. The last WEF NRI report available is for 2016.
First published in 2017, the 2019 Government AI Readiness Index (GovAirIn), a joint publication of Oxford Insights and Canada’s IDRC, developed an index including eleven variables, two directly taken from the latest NRI report. The data set now consists of all UN member states (193) plus Taiwan. Unfortunately, comparisons with the 2017 data set are impossible as the index has been redefined, the geographical coverage has expanded, and the data sources have changed substantially.
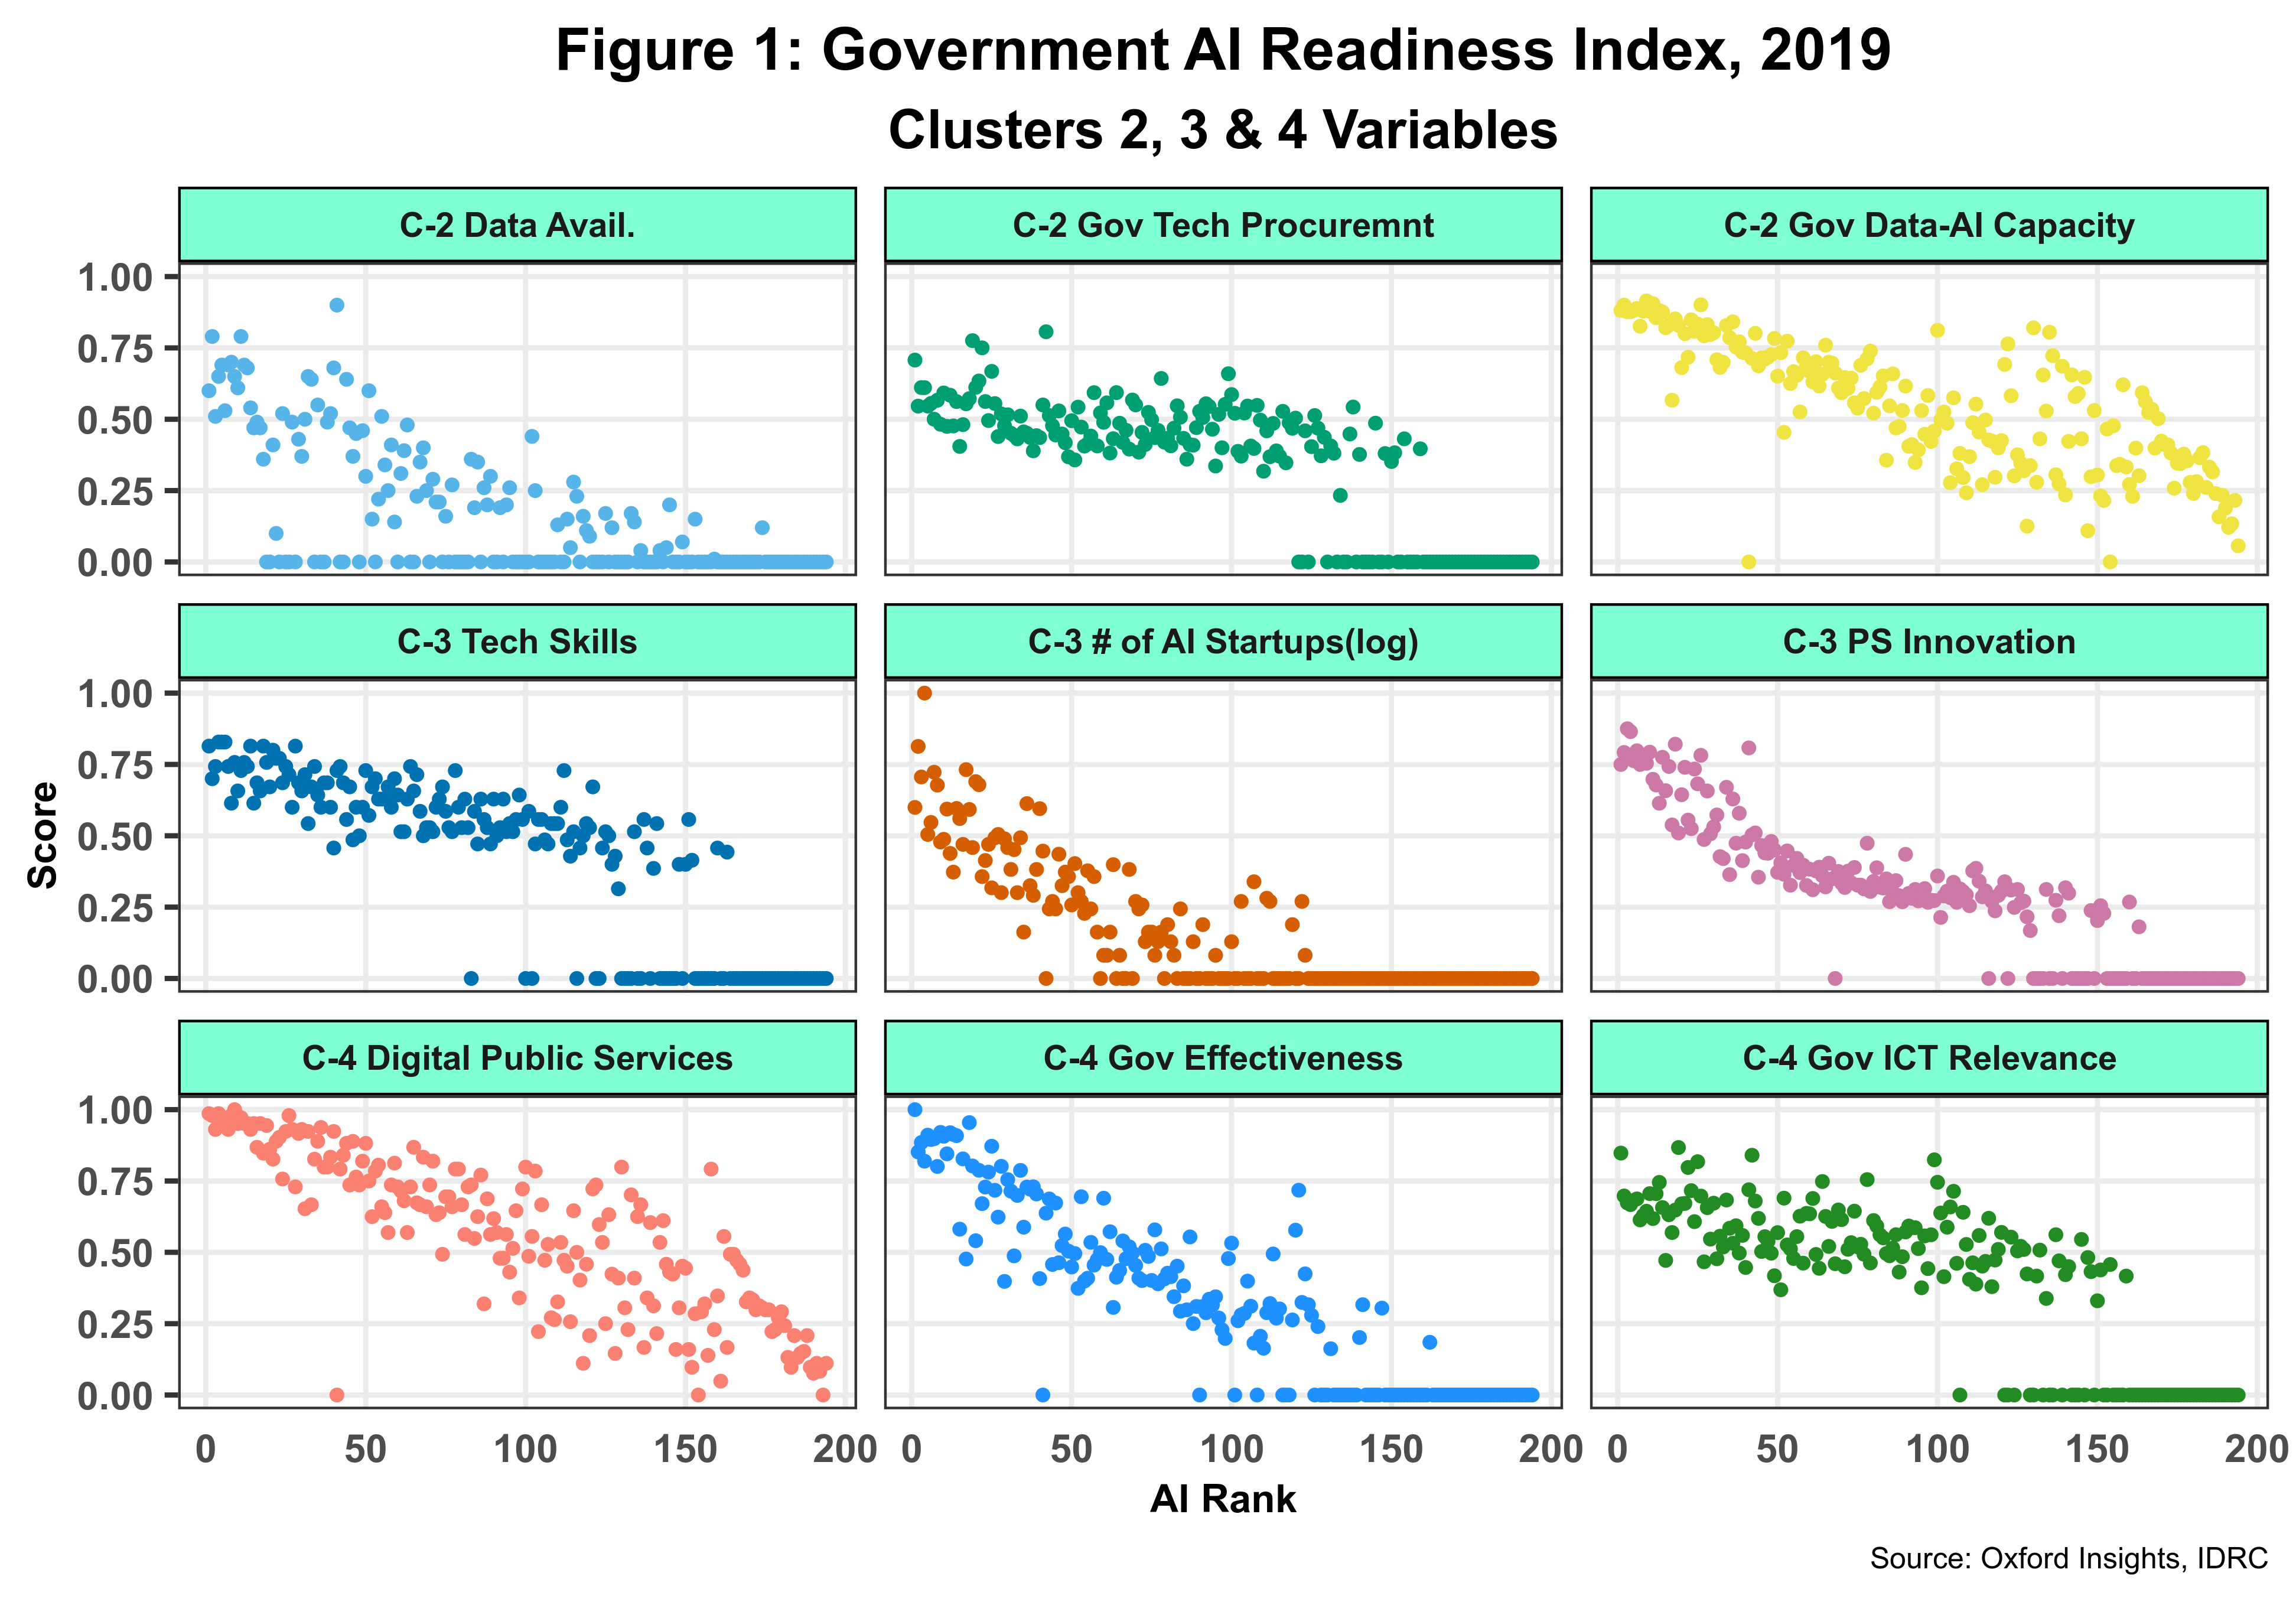
The eleven core variables are grouped into four clusters: 1. Governance. 2. Infrastructure and Data. 3. Skills and Education. And 4. Government (effectiveness) and Public Services. The Governance cluster comprises two discrete indicators, data protection/privacy laws and AI strategy development, reporting no missing data. The other three clusters include three continuous variables. Figure 1 depicts the nine variables that comprise such clusters.

The data set publicly available on the GovAirIn website does not include coding for missing values. Instead, missing country data is reported as having a zero value. The report acknowledges that missing data points are extensive, especially for developing nations. Figure 1 clearly depicts this gap, with indicators such as data availability and the number of AI startups with over 50% missing data. In fact, only 57 countries (or 29%) have data for all eleven core variables.
The GovAirIn score is calculated as the unweighted average of all eleven variables, previously normalized between 0 and 1. Figure 2 below presents the AI rankings by World Bank country income levels. The data is sorted by GDP per capita at constant prices. The light red line depicts the median AI Score for all countries in the sample.
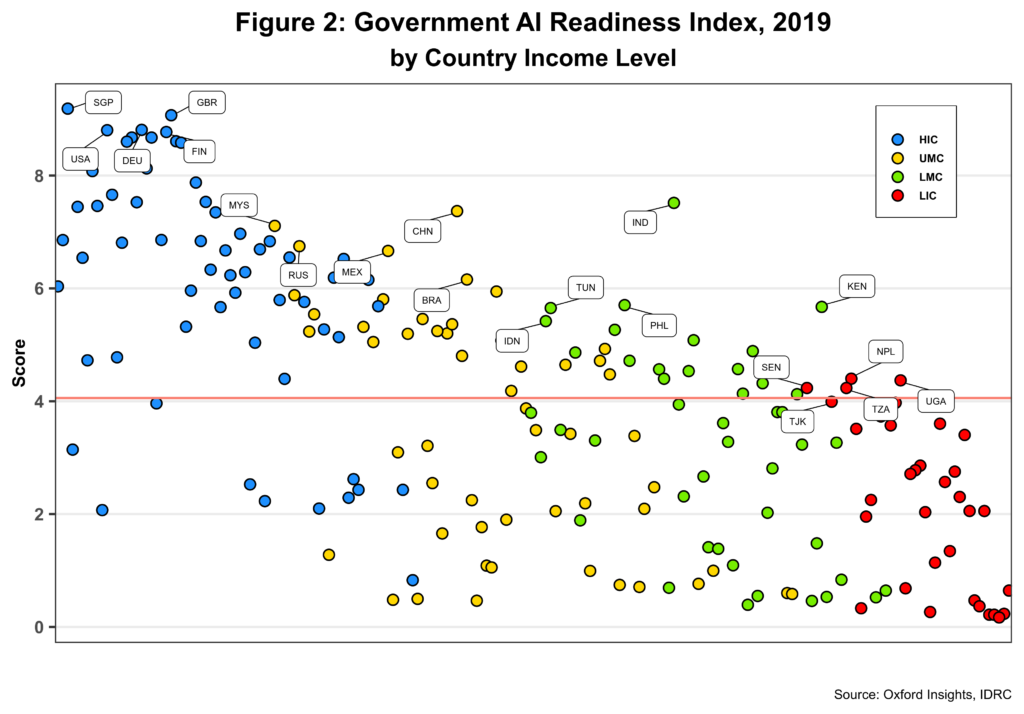 For each income category, the top five countries are highlighted. Singapore, China, India, and Nepal take the number one spot in each of the four-country income categories, thus suggesting that Asia is one of the prime movers. While some correlation between country income and AI score can be seen in the chart, the actual correlation coefficient is below 0.5 – and statistically insignificant. This is unexpected but could be partially explained by the lack of data for many countries and how the AI score is computed – including missing values or zeros in the estimation, which lowers the score for all countries impacted. This is why China is ranked 20th overall, for example. Note also that all income categories have countries below the median AI score, increasing as income levels fall from left to right.
At the continental level (figure 3 below), Kenya (ranked 52 overall), the U.S., Singapore, Great Britain, and Australia are top.
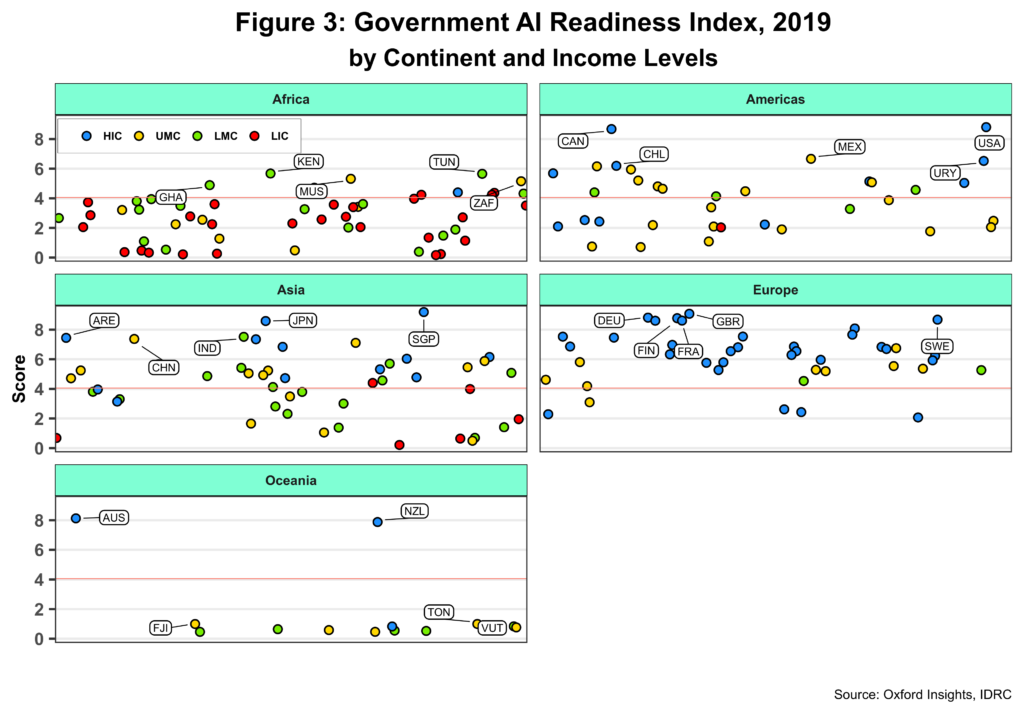
Africa is the only region where low-middle-income countries beat upper-middle-income ones. Note also that several low-income countries perform better than others in higher-income categories. Nevertheless, most African nations have difficulty crossing the median AI score. Mexico is ranked third in the Americas, behind the U.S. and Canada, surpassing high-income countries such as Chile and Uruguay. On the other hand, Europe is the only region where most countries (89%) find themselves above the median AI score. As expected, Asia’s overall performance is impressive and could be even better if data estimations accounted for missing data. Asia is also boosted by the inclusion of Gulf countries, which are the ones that fund most AI strategies and initiatives.
What about the role of political regimes in fostering AI development? Figure 4 shows GAIRI rankings by political regime, based on the EIU Democracy Index, available for 167 countries. EUI defines four types of political regimes, from full democracies to authoritarian states.
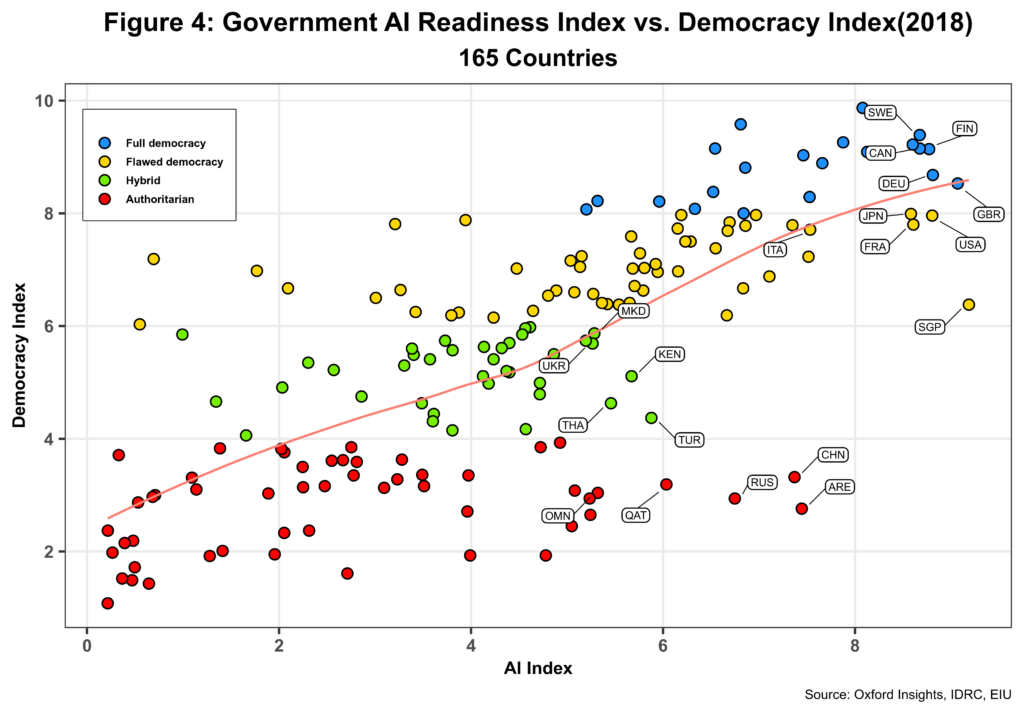
The graph presents the top five countries for the four political regimes. Great Britain, Singapore, Turkey, and the UAE are the best performers in each category. A close correlation between the two indices can be intuitively seen in the chart. The actual correlation coefficient is 0.72 and has statistical significance. While this is much higher than GDP and AI scores, the difference could be partially explained by the smaller sample size used here (and thus, fewer missing data). When crossing the hybrid regimes category, the light red line depicts a polynomial trend with a clear ascending inflection point. Indeed, several authoritarian states are ahead of many hybrid regimes when deploying AI. Moreover, suppose we guide ourselves only by the trend line. In that case, higher AI scores are associated with relatively lower levels of democracy, especially in the case of both total and (so-called) flawed democracies.
The role played by the four clusters identified in the GovAirIn report is not evident at first sight. If the AI score is the simple average of our eleven indicators, one could move them across the various clusters and still obtain the same country’s AI score. This raises the broader issue of the apparent lack of a conceptual framework to develop such clusters more systematically. For example, one could argue that the governance cluster looks more like a policy one and should also include the relevance of ICT in government. On the other hand, the current cluster structure helps shed some light on the critical significance of some of the proposed indicators, as seen below.
Much like the AI score, each cluster value per country is computed as the average of its normalized indicators. As mentioned above, the Governance cluster only takes a set of discrete values (four in total), so comparisons with the others via graphics are less than ideal. Figure 5 shows the comparative distribution of the other three clusters sorted by country rank, excluding all missing data. The graph also fits a polynomial trend line for each cluster and a regression line (in black) for the whole sample.
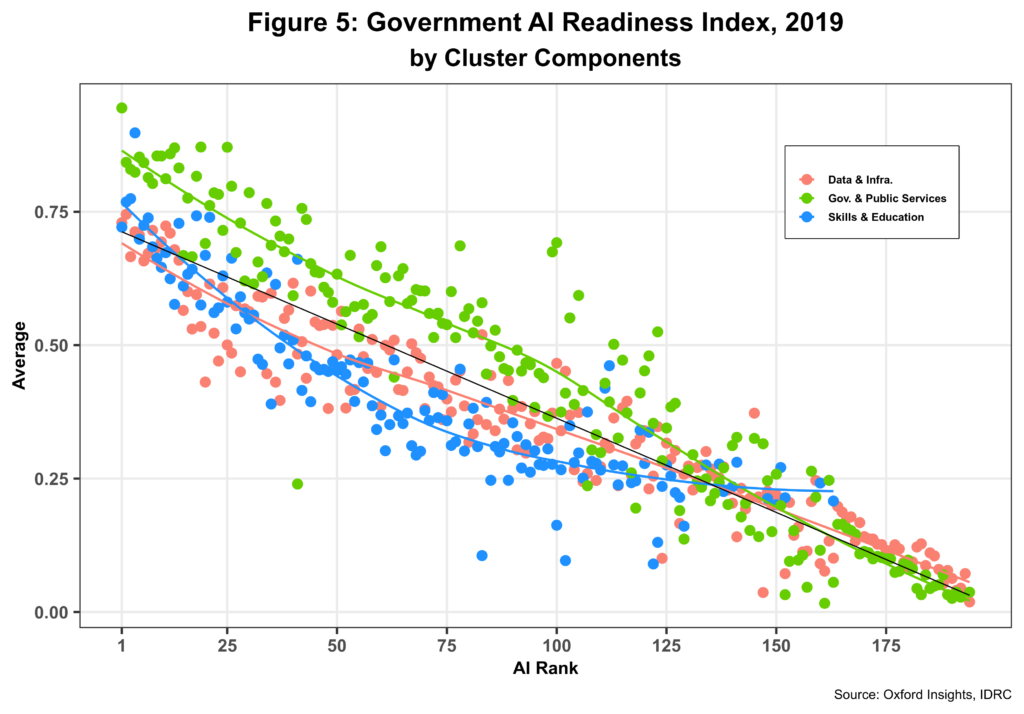
Using the regression line as a reference, we can see that the government effectiveness and digital service provision of the digital public services cluster pull up the AI score, especially for most high-ranked countries. The trend starts to change for countries ranked over 100 or so. On the other hand, the other two clusters are pulling down the AI score for almost the same group of countries. The trend for both clusters then reverses itself for lower-ranked countries. In any event, the data shows state capacity’s critical importance in effectively harnessing AI. States with low capacity will undoubtedly face many challenges unless they can also use AI to build and increase overall state capacity.
A sound analytical framework for the analysis and ensuing measurements should have four core pillars: 1. Policy, not limited to technology. 2. Technology, including innovation, overall startup environment, etc. 3. Capacity, including both institutional and human and not limited to technology. And 4. Infrastructure, including some of the themes mentioned in the introduction to this post.
Each pillar, in turn, should be interrelated and sequenced accordingly, with state capacity taking center stage as we are dealing with Government AI readiness. However, governments must also be able to create adequate policies, harness technologies, and support infrastructure deployment around the country. This does not mean governments need to do everything on their own. Here, the distinction between design and implementation is crucial. Once the former is in place, the best professionals in the areas under consideration can execute the latter.
Let us remind ourselves that building state capacity in developing countries is also part of the UN SDGs.
Cheers, Raúl
