The complexity of measuring RAI in over one hundred countries covering all regions should not be underestimated. GIRAI’s undertaking should thereby be acknowledged and openly praised. In a previous life, I had the opportunity to manage a global ICT for development program covering over 50 countries in all regions. While sleep time suffered quite a bit, the complexity of keeping the engines going 24/7 was one of the main challenges. Administrative and managerial chores were more demanding than expected and competed heavily with the technical difficulties that inevitably emerged when running a network of servers in all those locations supported by locally recruited staff. Thus, I know firsthand the effort required to run such global projects and fully appreciate the endeavor.
Unlike my tech program, GIRAI’s core task was to collect data for the various thematic areas and pillars envisaged in the framework and, on that basis, build the indicators required to compute the index score and others. In total, 57 indicators per country (19 thematic areas and three pillars) were developed, amounting to 7,866 (57×138). In addition, three additional coefficients (one per pillar) per country were built based on secondary sources. Therefore, the total number of possible data points was 8,280 (7,866+414) or 60 per country. That is undoubtedly a relatively large number that requires critical financial resources to design, capture, process and systematize but demands little computational capacity. Of the indices I know, only The Economist Intelligence Unit Democracy Index (EDI) compares. It also captures 60 indicators distributed along five core thematic areas for 167 countries. EDI uses a similar methodology (expert interviews) but avoids weights and coefficients. Another distinction is that it checks indicator values against well-known global databases on the topic to ensure consistency.
As mentioned in the previous post, one of GIRAI’s critical statistical gaps is the pervasive number of zero cores across all 19 thematic areas and normalized pillar scores. Since the data does not define missing values (NAs), I have to assume zero scores denote that such data points do not exist in the country in question. Indeed, 66 percent of all three pillar scores have zero values. Furthermore, of the remaining 33 percent, NSA accounts for 40.4 percent (or 1,075 data points), while Gf only reaches 27.8 percent. This uneven distribution of non-zero scores could be interpreted as the result of response rates per pillar per country. On average, NSA response rates were much higher than those in the other two pillars. In this light, assigning weights to counter the even response rate might be reasonable. However, as previously seen, eliminating weights does not change index score rankings dramatically.
The figure below shows the distribution of normalized pillar scores greater than zero by thematic area. These are sorted by dimension: human rights (7), capacity (3), and governance (9).
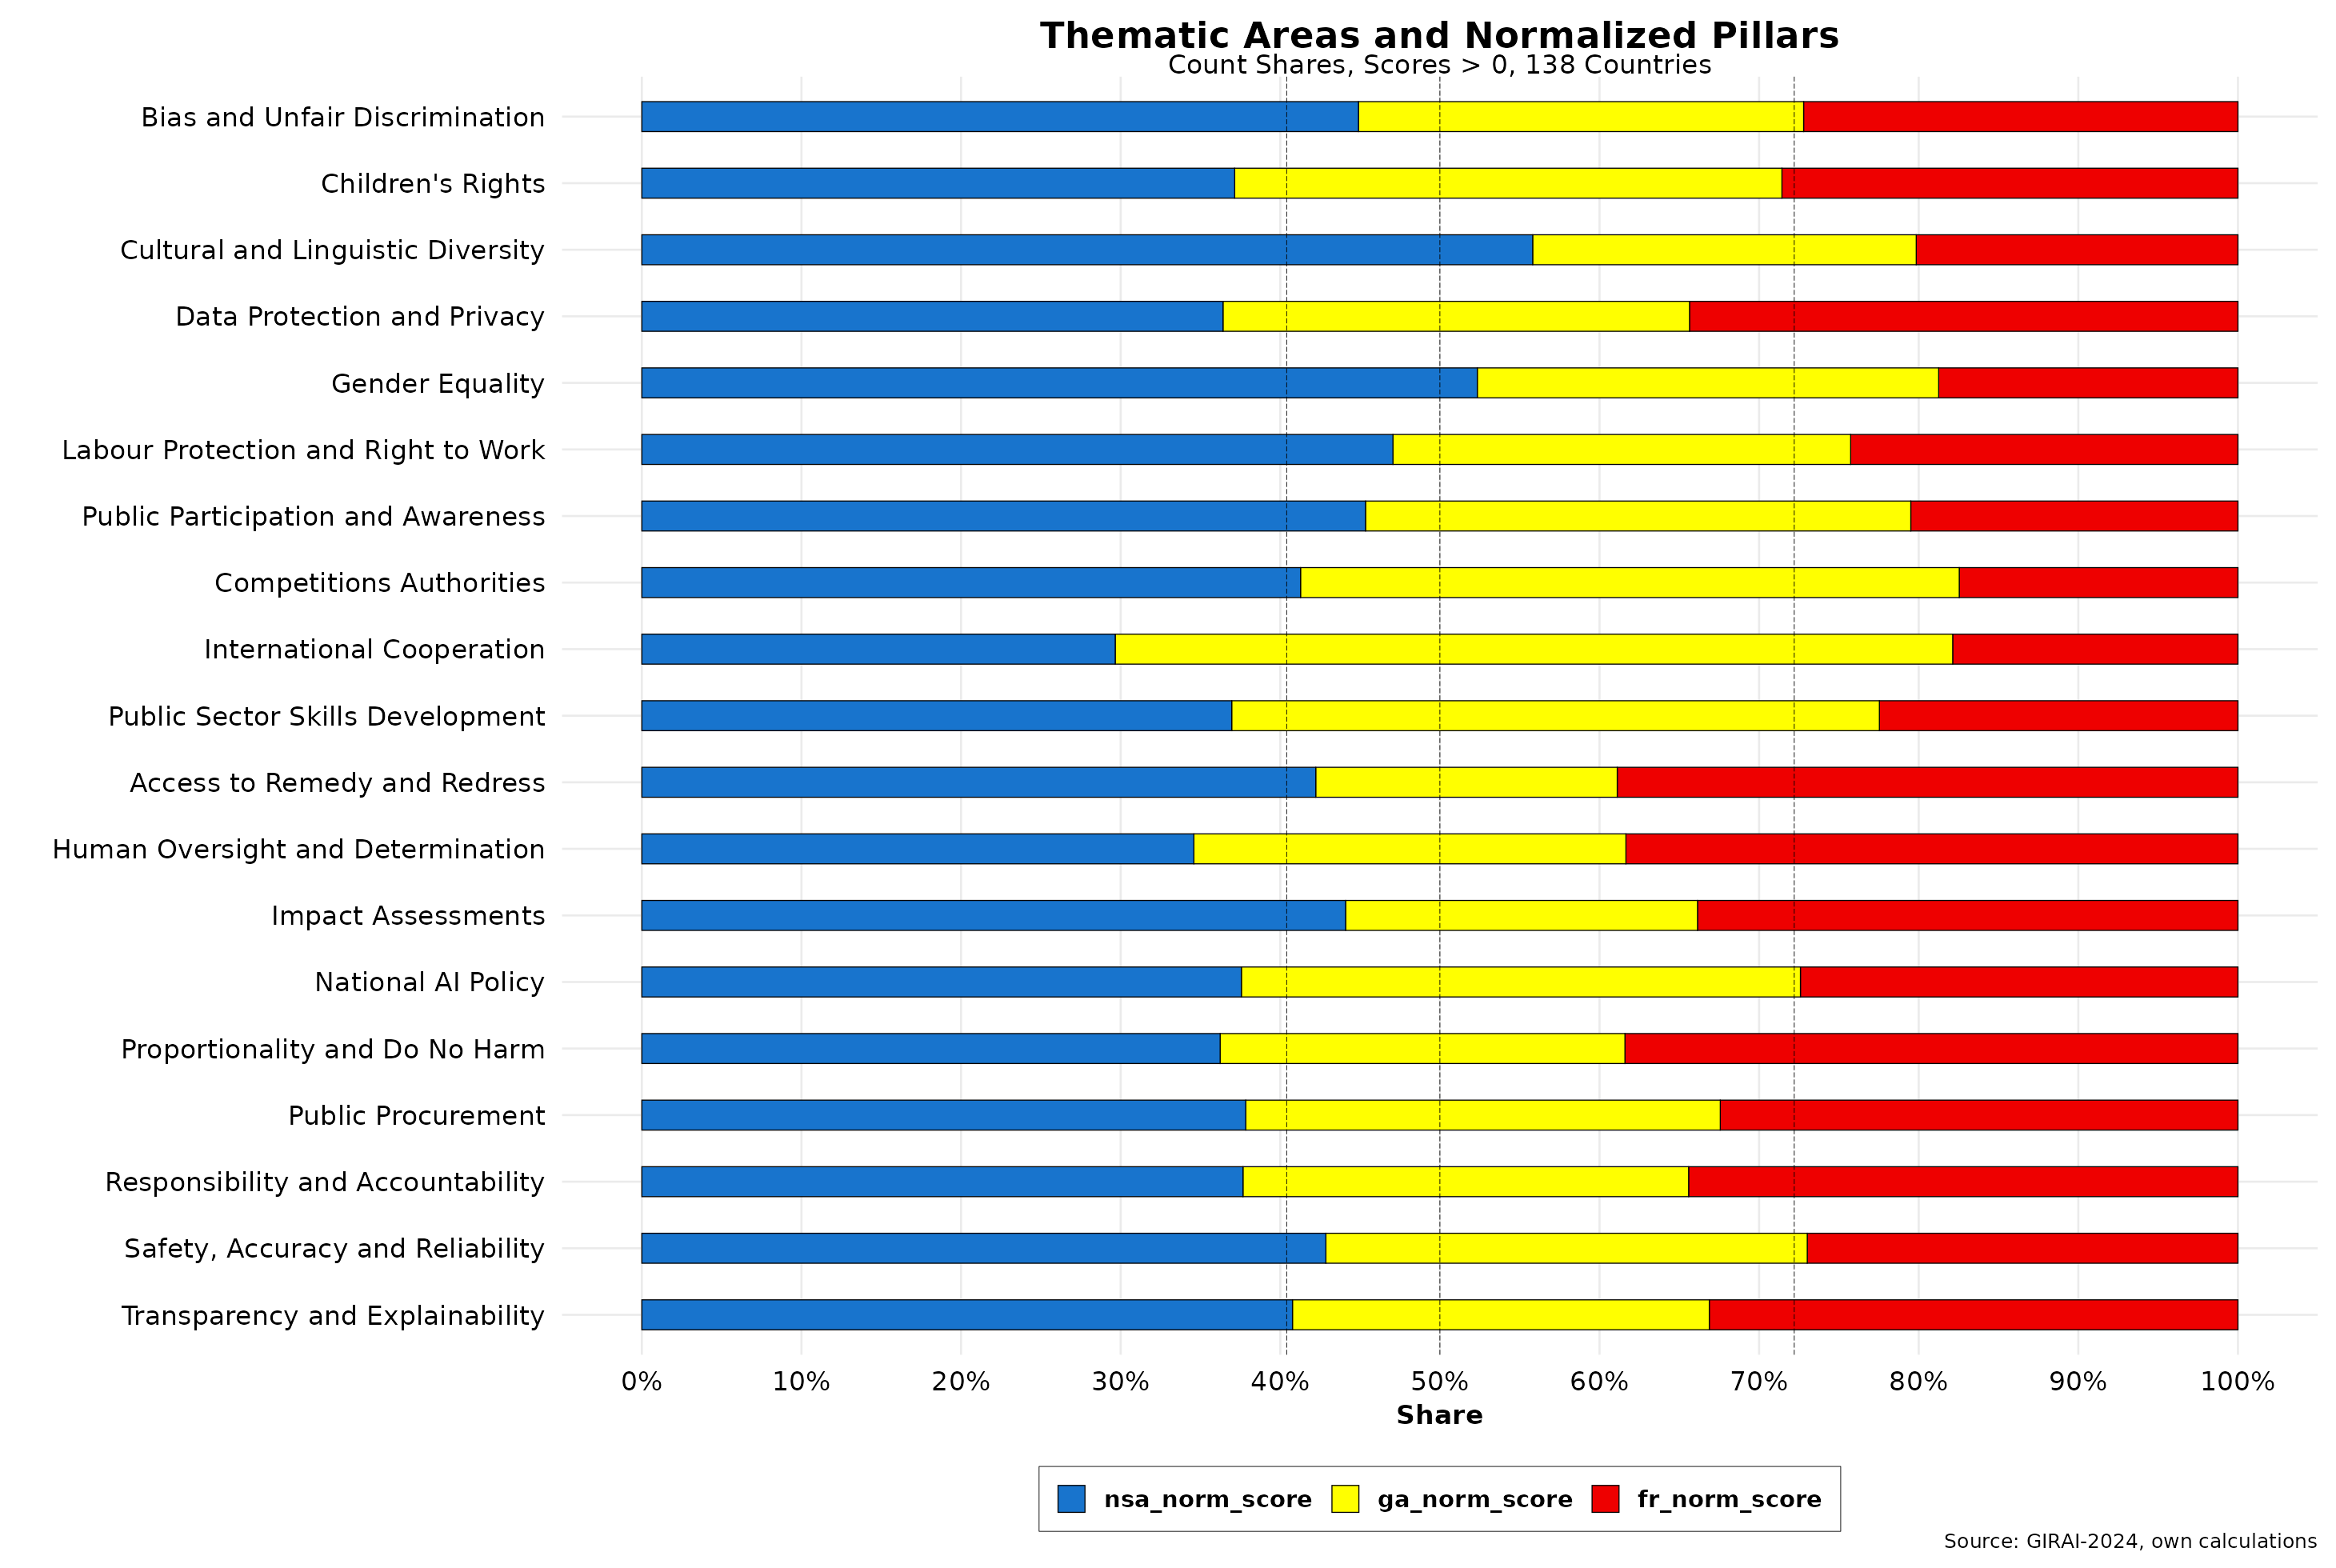
Here, we get a more nuanced view of the distribution of the NSA normalized pillar. It has a share of over 40.4 percent in ten of the 19 areas and is below 33 percent only in one (international cooperation). It accounts for more than 50 percent coverage in two thematic areas. On the other hand, Gf is below its 27.8 percent average in 10 areas, but it varies much more than NSA across areas. Ga is above its average (31.8) in only 6 areas, accounting for 52 percent in international cooperation. It is below the average in all other thematic areas. Pillar interpretation is also somewhat challenging. Take the competition authorities area, which is primordially a state function vis-à-vis policy and implementation. However, Ga is below 20 percent while NSA is almost 41 percent, which matches Ga’s. How to interpret the NSA’s high score in this rubric is unclear. The same goes for a few others. In any event, NSA is relatively overrepresented in most thematic areas.
The distribution of normalized variables by dimension suggests additional complexities, as shown in the figure below.
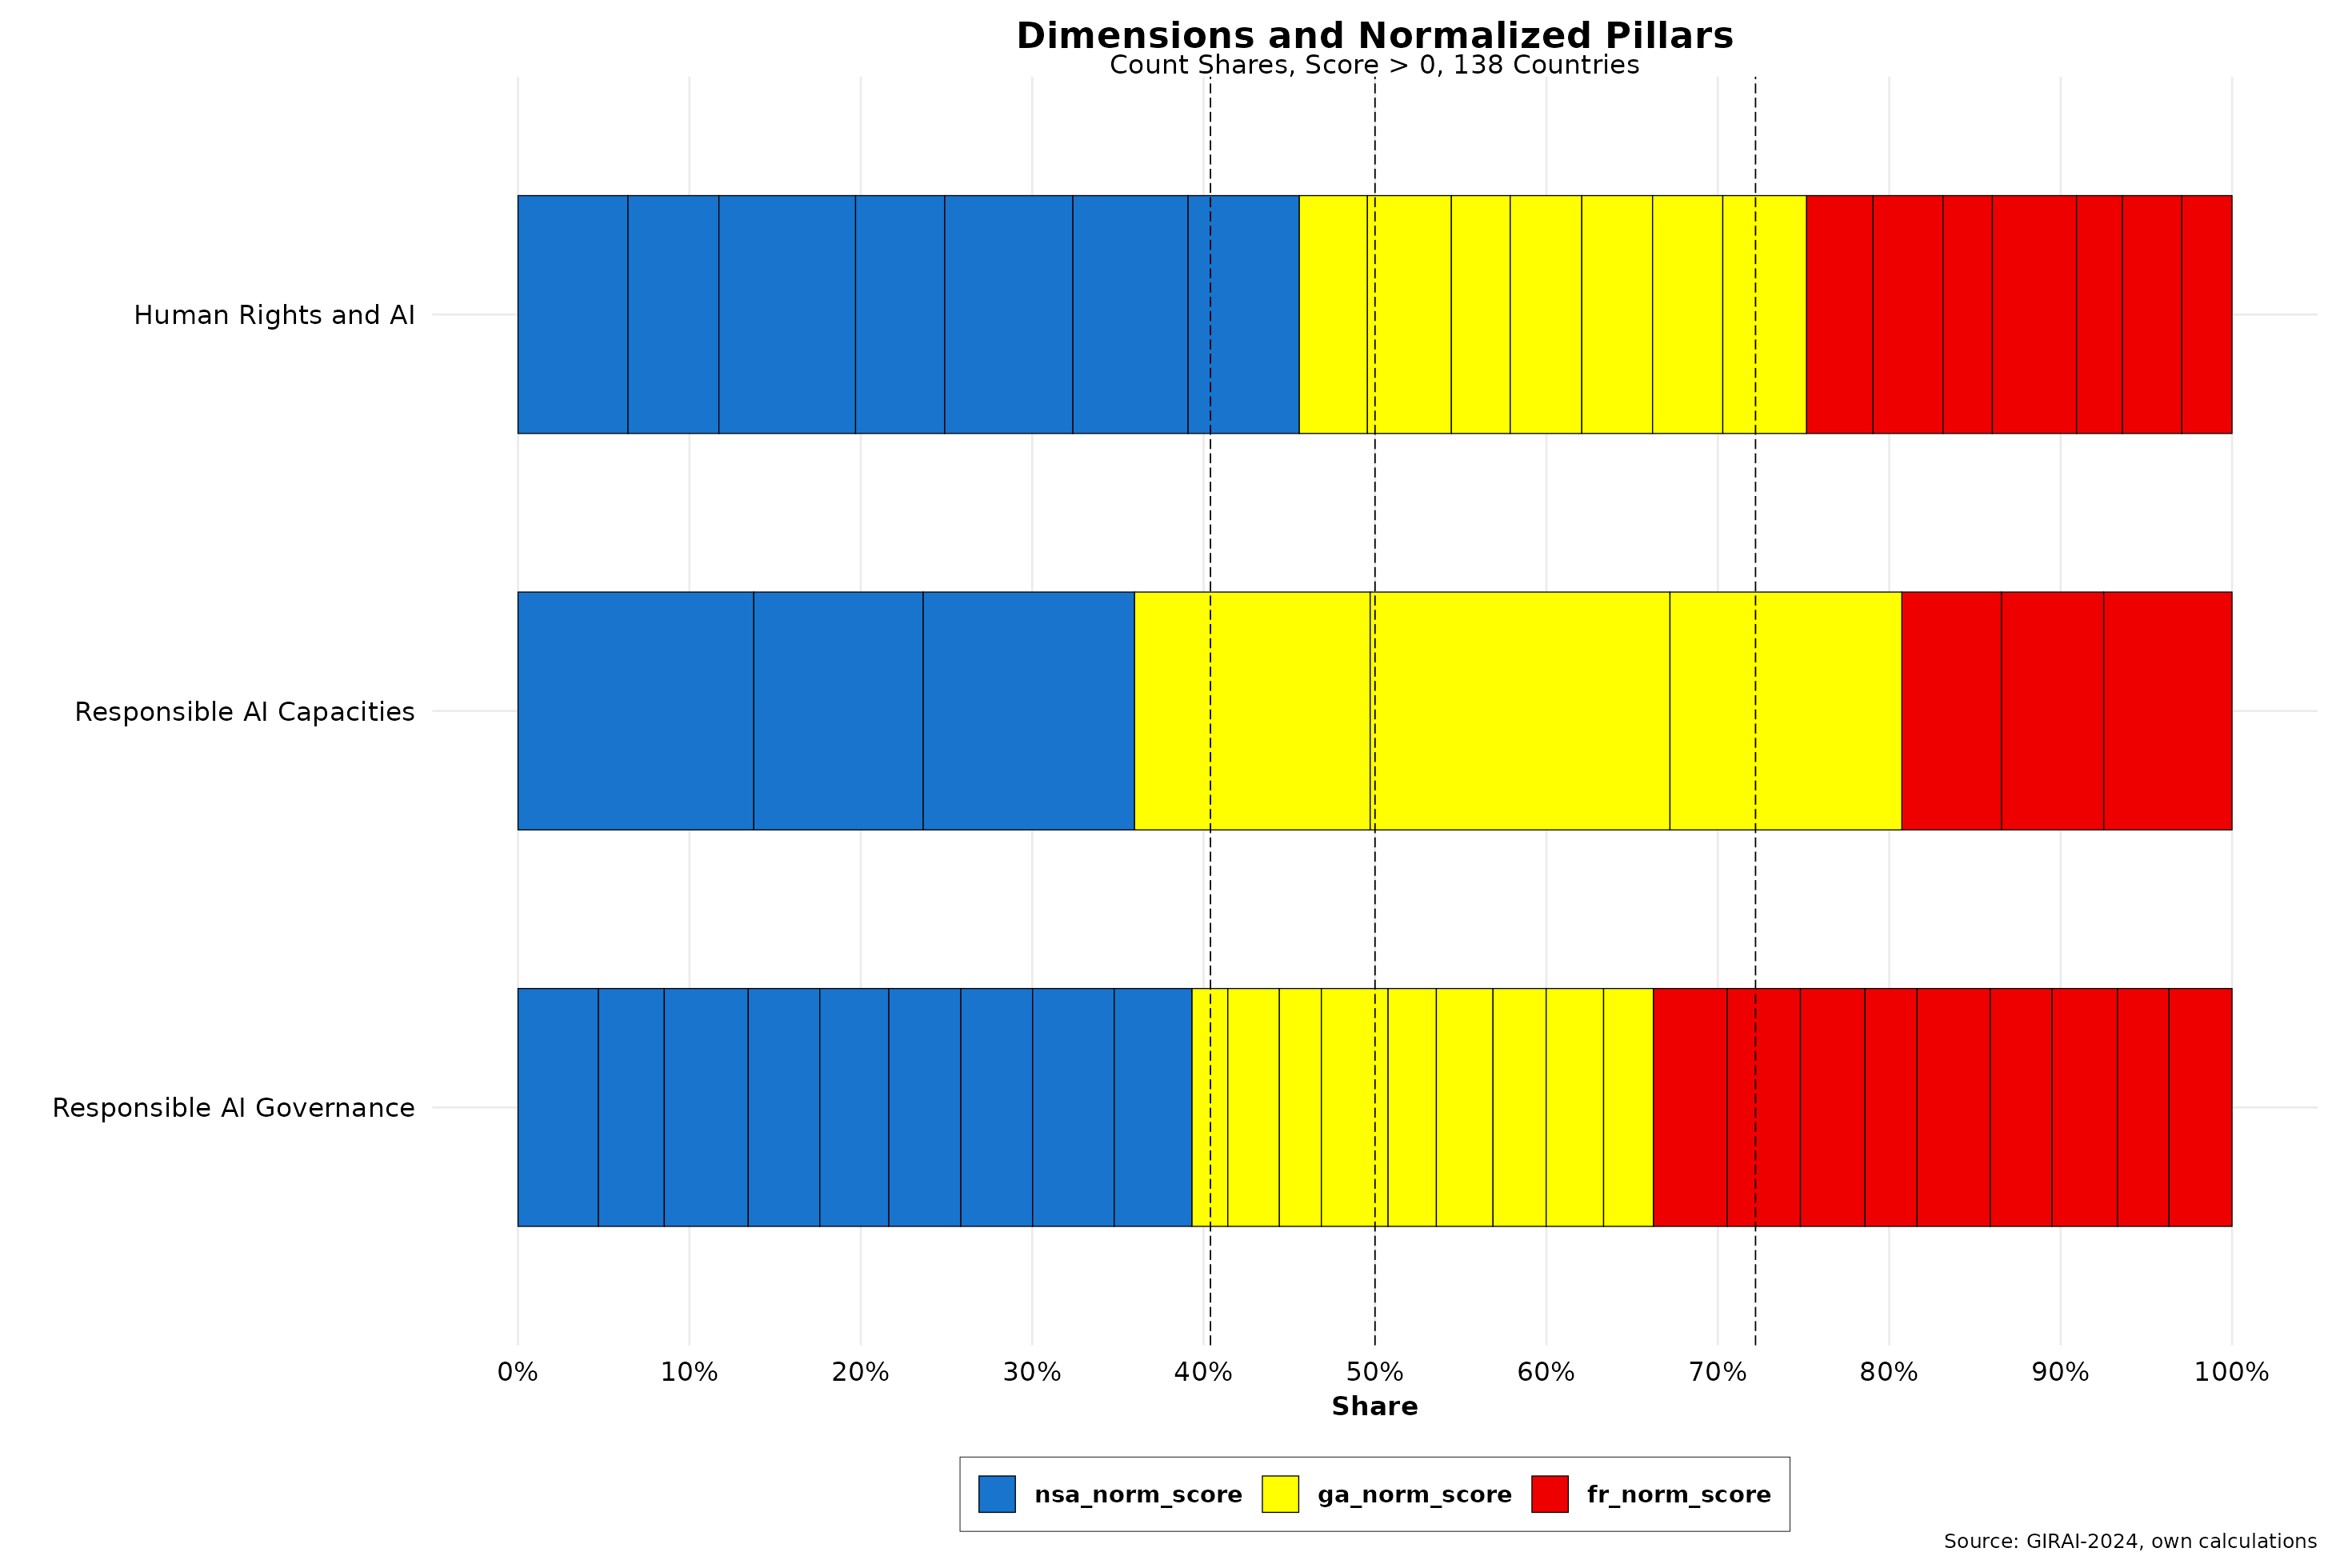 While NSA is the indisputable leader in the Human Rights cluster, which in theory is expected, it is less effective in the Capacities dimension. However, that is because the Ga for the international cooperation thematic area is over 52 percent and is the only normalized variable that covers all countries in the data set. The NSA variable for that same area is, in fact, a distance second overall, covering 78 countries. So, while its relative share is below average, its coverage in terms of countries is well above average. In any event, the spread of Gf in that same dimension appears to have been underreported.
Examining the same at the regional level reveals fascinating details, as shown in the figure below (click to enlarge). I am using the regions defined by GIRAI that do not match those used by the WB here. I have again excluded North America, which in this case includes three countries with the addition of Mexico, ranked 64 with yet another low score of 15.8.
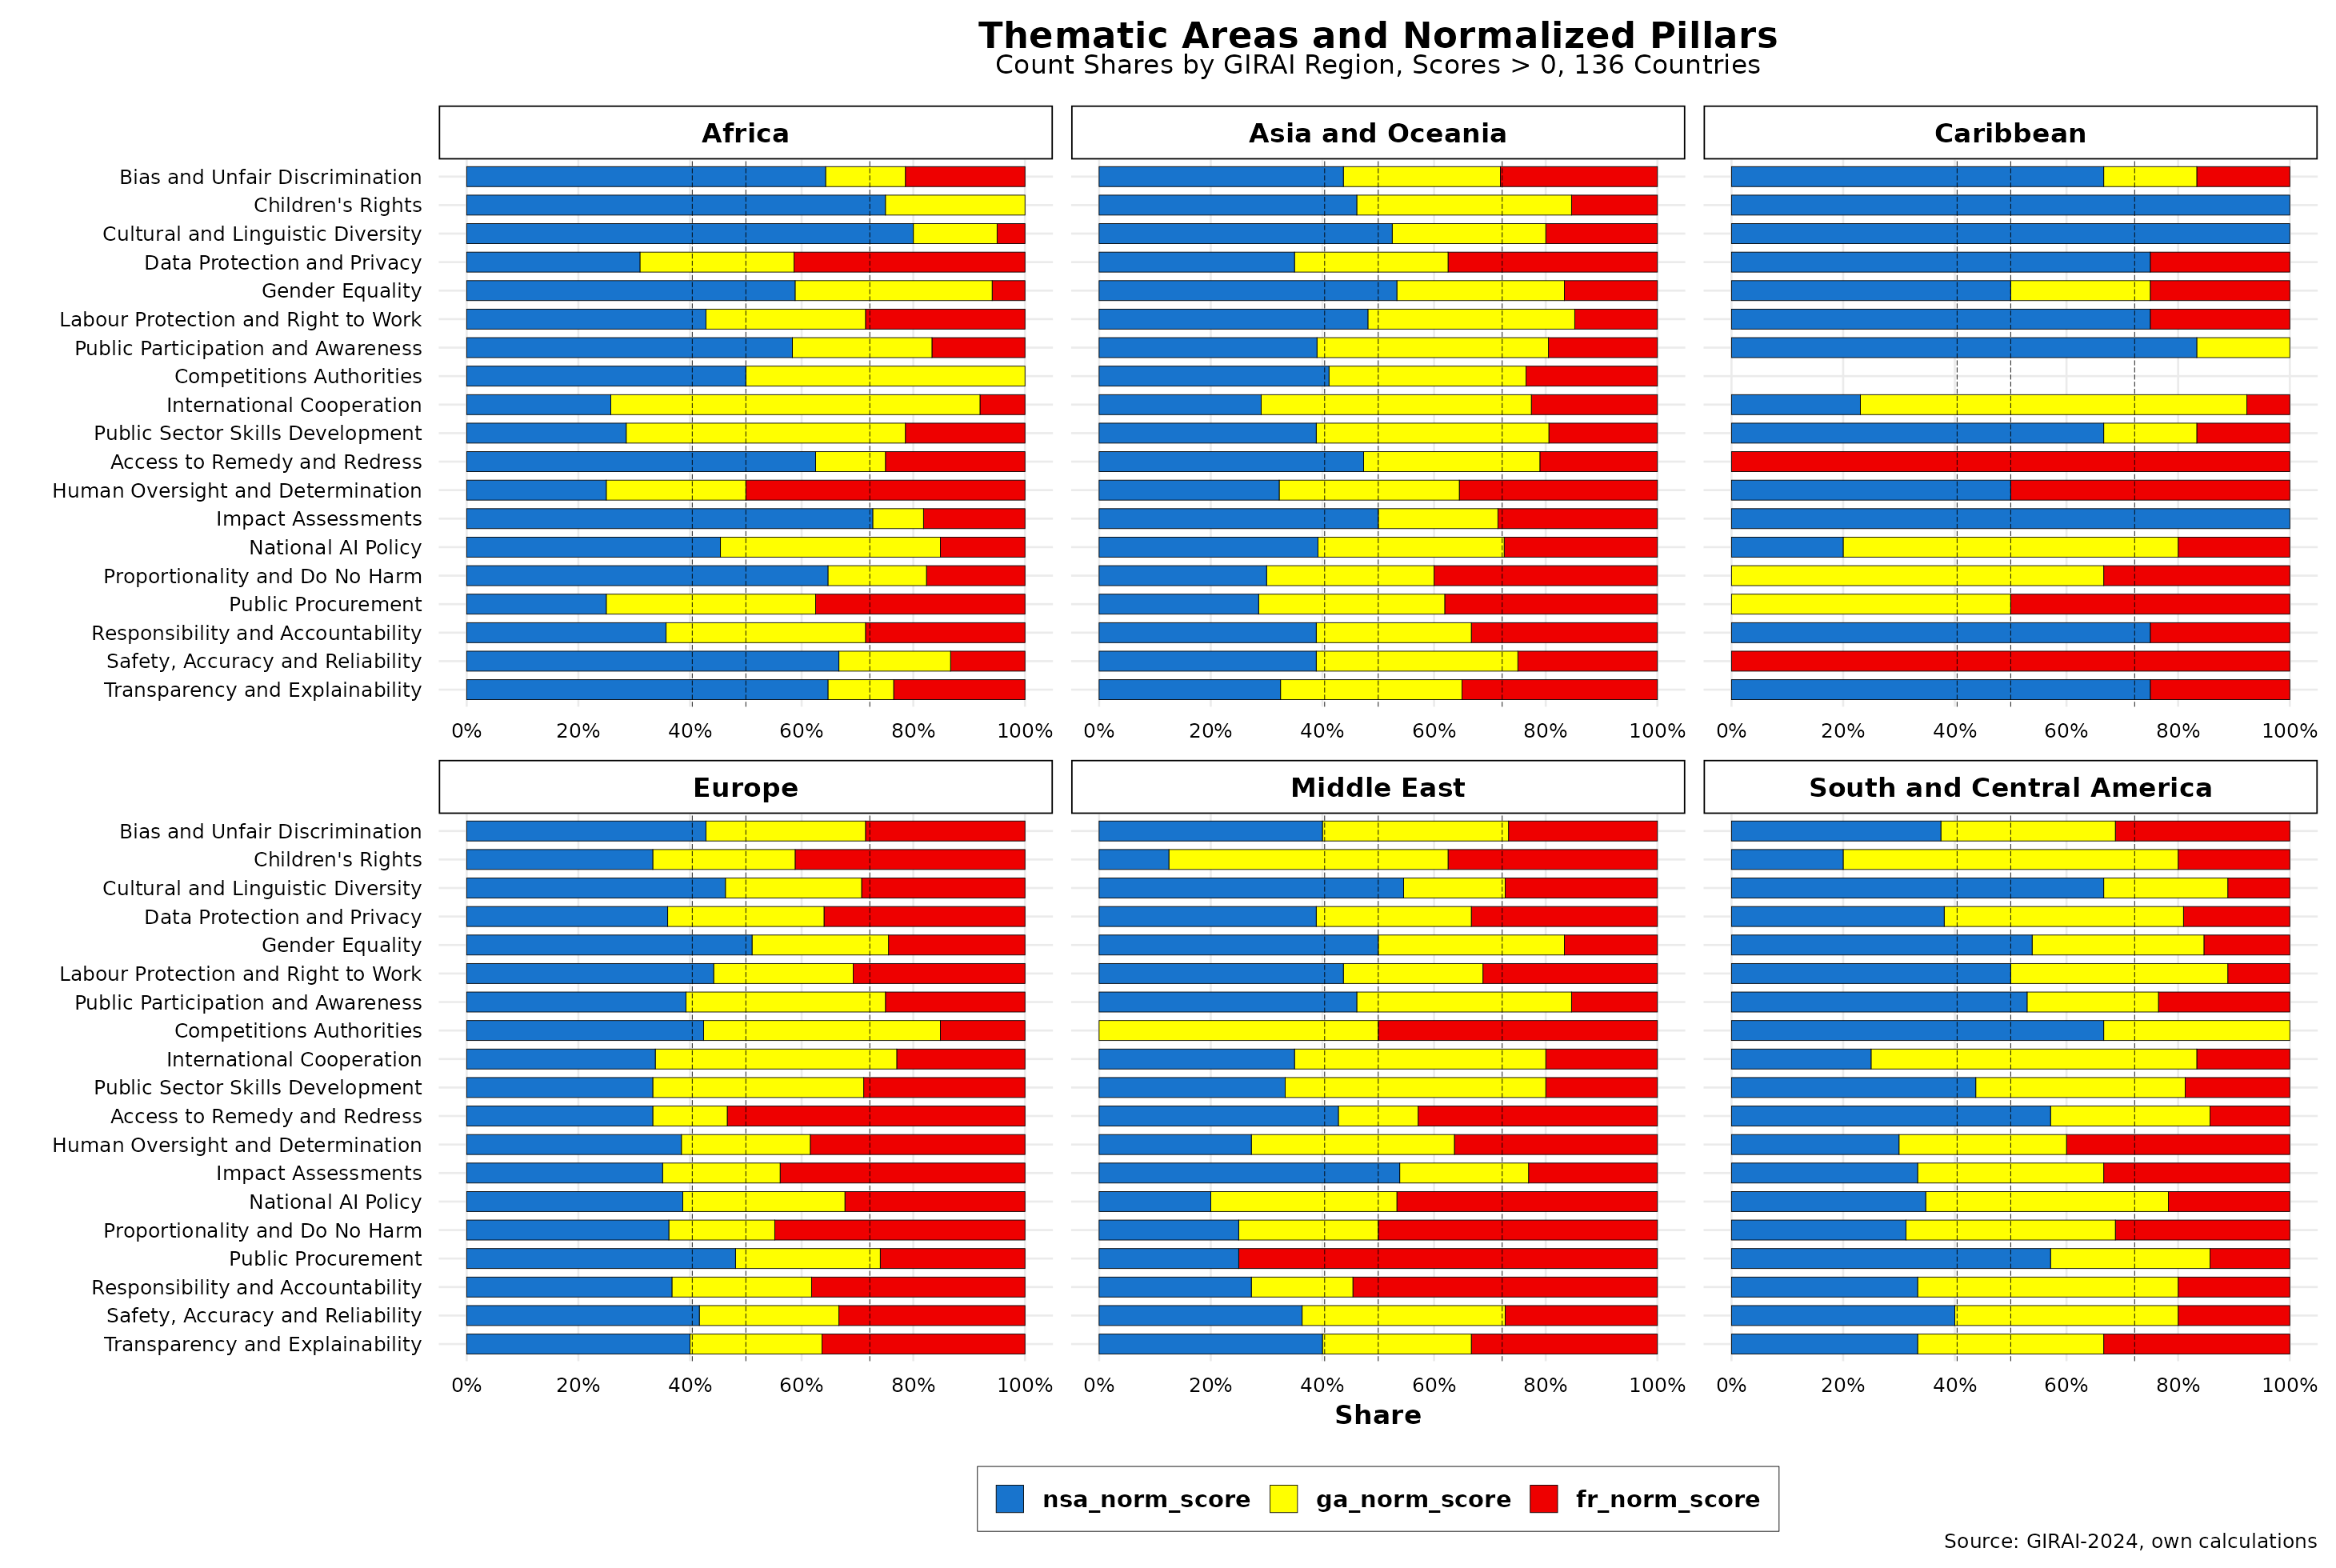
Europe and, to a lesser extent, Asia and Oceania, depict a more or less even distribution among the three normalized pillars. Africa and South and Central America rely much more on NSA pillar coverage for many thematic areas. The Middle East seems to have much affection for Gf as it performs above average in ten thematic areas. However, the Caribbean appears to have been colonized by the NSA body snatchers. Indeed, 13 of the thematic areas are under NSA rule, while only three include all three normalized variables. That raises many questions regarding data collection, compilation, and aggregation and could impact statistical randomness and related estimations. That said, NSA’s preponderance seems to appear in most thematic areas and dimensions.
In theory, NSA indicators estimate the degree of participation and engagement of non-state actors in GIRAI’s thematic areas and dimensions. That is undoubtedly a critical component that cannot be ignored. Similarly, GIRAI’s RAI approach is centered on human rights. Both should be closely correlated to regime types in the 138 countries under consideration. Using EDI (mentioned above) as a reference provides the means to test such a relationship. Fortunately, GIRAI and EDI use similar methodologies to develop their respective indicators. We should expect a positive correlation between GIRAI rankings and EDI scores — the higher the latter, the higher the former.
The figure below depicts the interaction between GIRAI scores and political regimes defined by EDI. Only 131 countries are included, as seven in EDI are not part of GIRAI’s geographical coverage—including top democracy index leaders such as Norway, Sweden, and Denmark. The top seven per regime are highlighted — those missing are due to the differential country coverage between the two indices. The number in parentheses after the country ISO label indicates the country’s EDI ranking within a regime type.
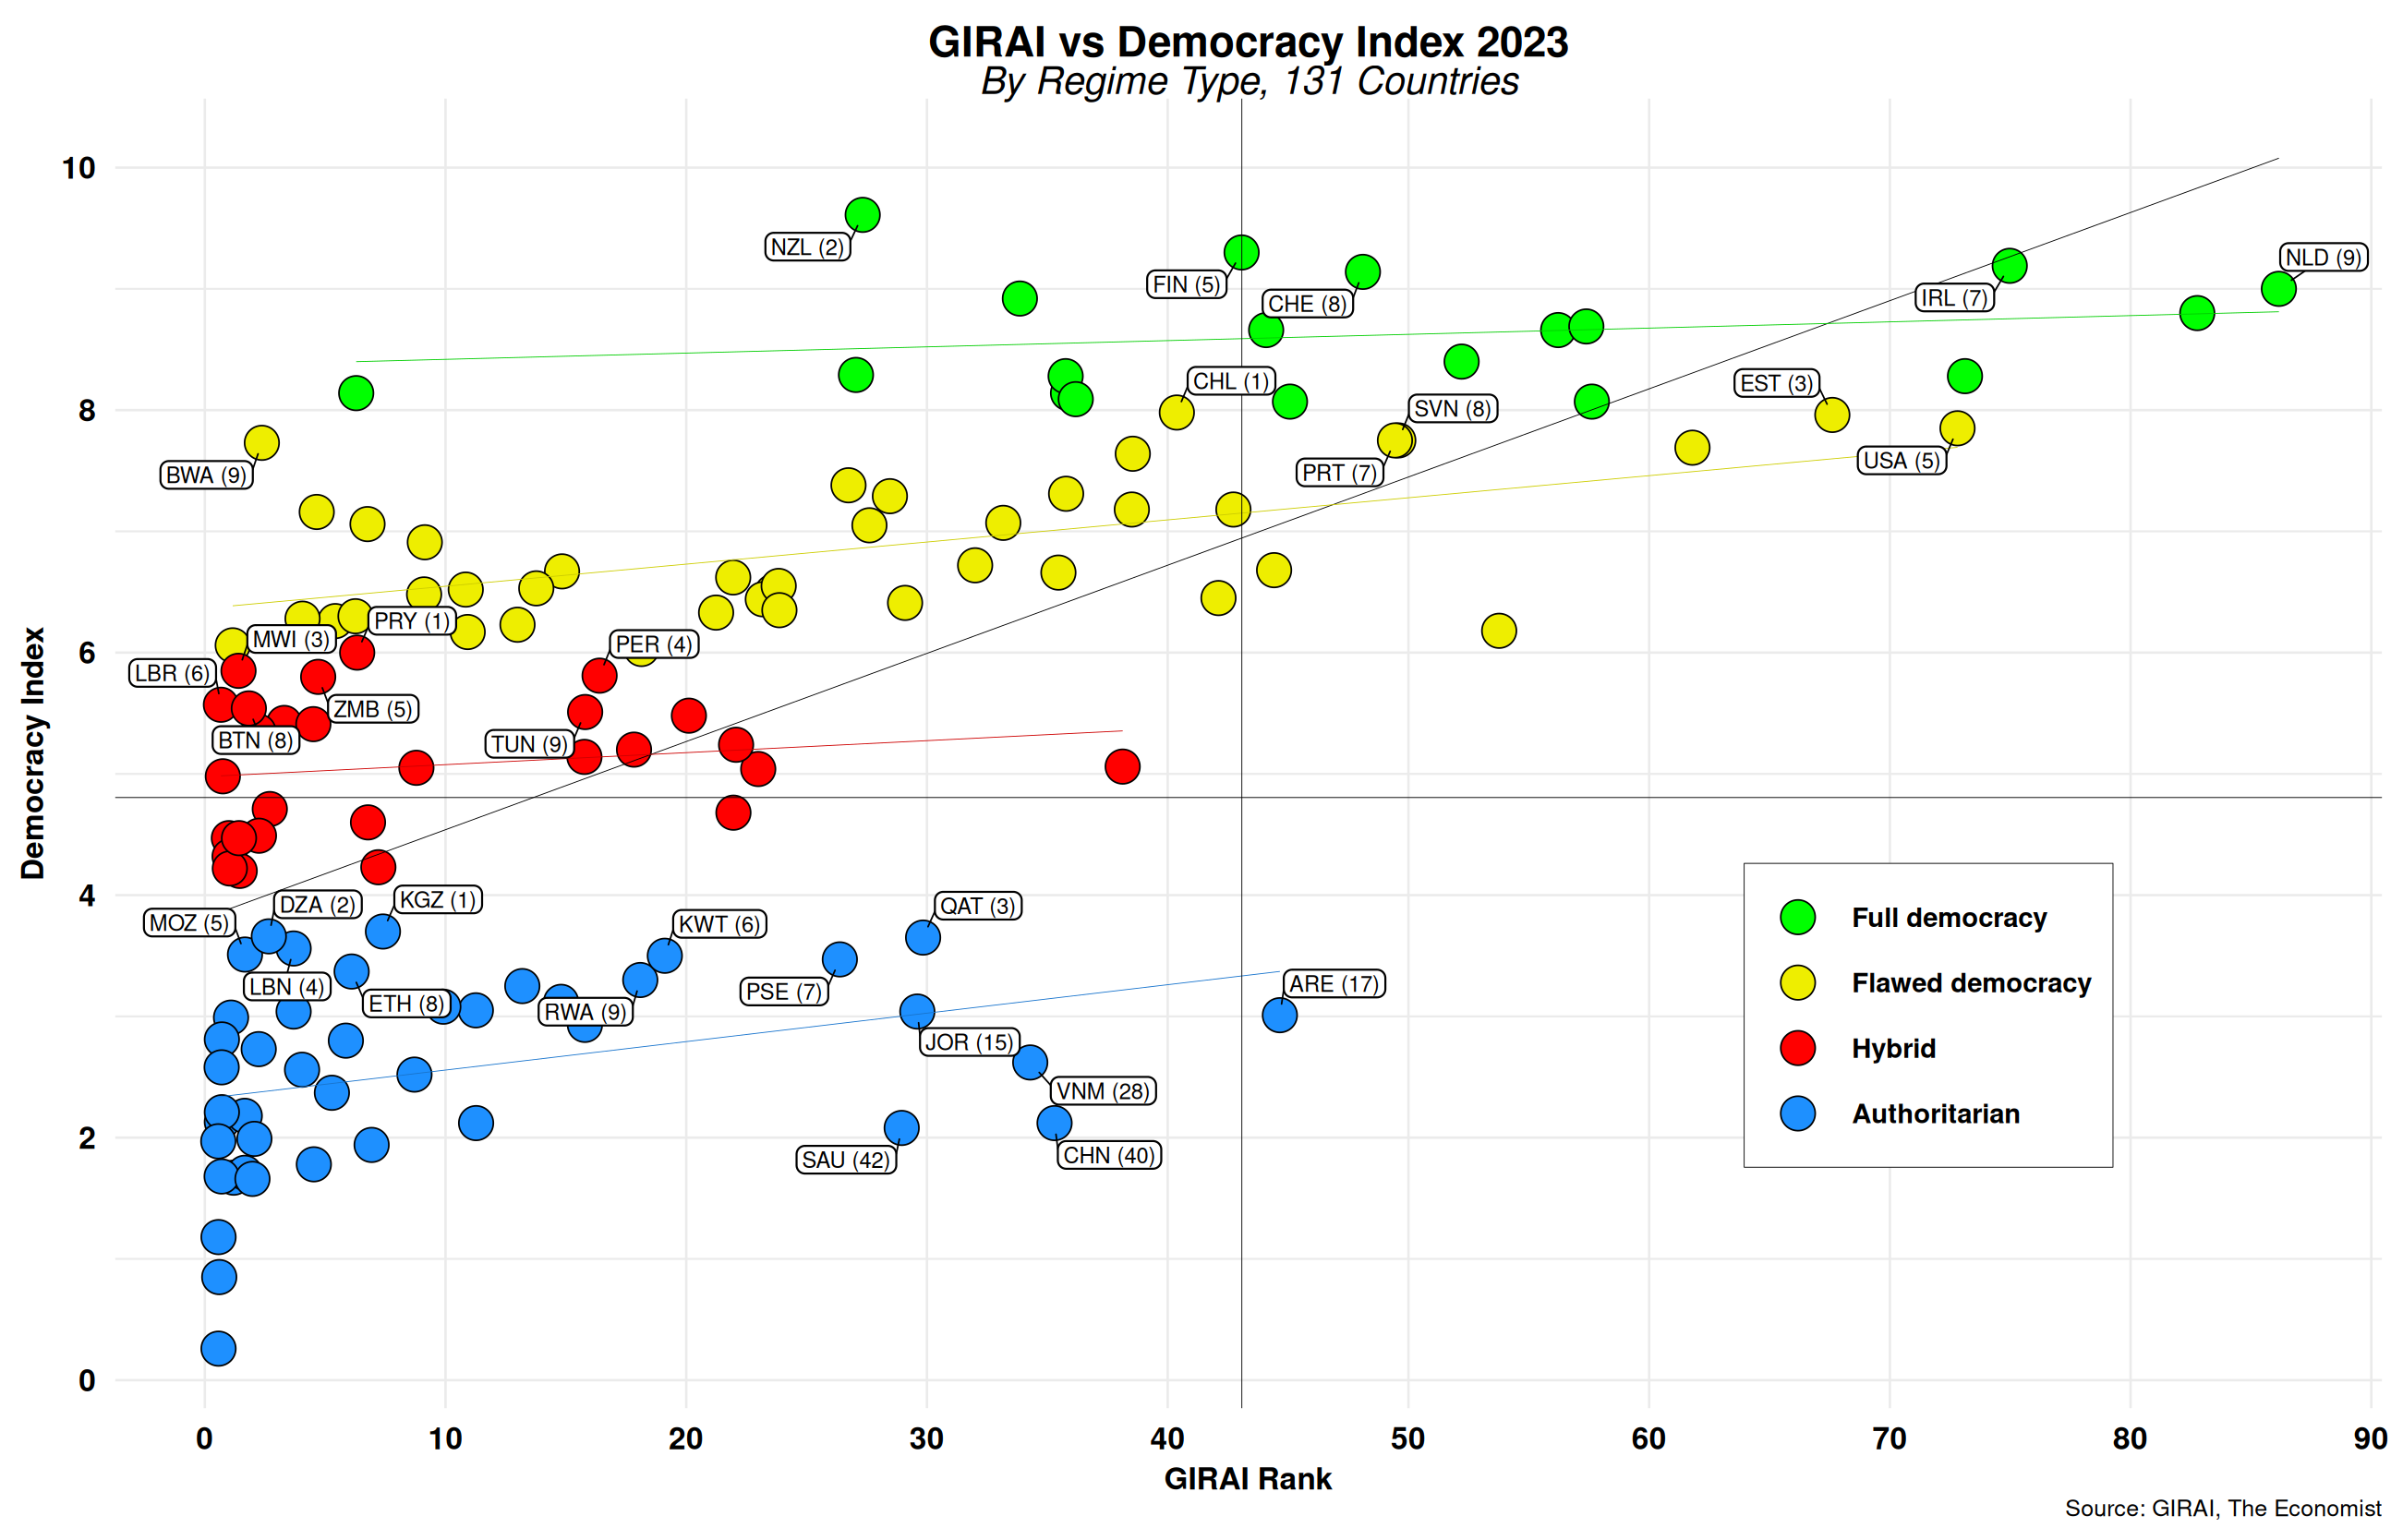
I have divided the set into four equal quadrants, using each score mid-point as a reference. The thin black ascending line depicts the regression result for all regimes. In addition, regression lines for each regime type are also included. At first glance, countries near the overall regression line in the upper right and bottom left quadrants perform as expected. GIRAI rank and EDI scores move in the same direction, with a few outliers. Nations in the upper left and lower right show the opposite relationship. Higher degrees of democracy do not translate into higher GIRAI scores. On the contrary, so-called “authoritarian” regimes (lower left quadrant) show a strong inverse relationship between democracy development and RAI performance. I have highlighted countries with high GIRAI rankings in this rubric to emphasize this point. Similarly, “hybrid” regimes in the upper right show that higher democracy levels do not automatically translate into RAI gains.
A simple regression model between GIRAI scores and each regime type shows positive statistical significance only for “full democracies.” All other regime types show an inverse relationship, contrary to expectations. Our initial hypothesis is thus not fully supported. We can conclude that GIRAI score increases are not dependent on political regimes. Such a result is undoubtedly not a GIRAI feature, needless to say. But poking deeper into the thematic areas covered by GIRAI for these set of countries could shed more light.
The launch of GIRAI is certainly most welcome. However, it still seems to be a work in progress. I have highlighted a series of issues, ranging from a lack of information and conceptual clarity to statistical ones, including overreliance on coefficients and weights and spurious coefficients. Most of these can be quickly addressed, however. In that light, GIRAI should be on track to continue to measure RAI responsibly.
Raul
Updated on 2024-09-09 to correct regime graph and analysis.
