Before diving into the IXP data pool, let us recap some of their advantages. First, IXPs are ideal for keeping local IP traffic local, thus preventing tromboning. Second, IXPs can reduce costs by letting clients avoid paying potentially high transit fees to Tier 1 providers along the way. Third, IXPs can shift IP traffic governance by moving the focus from traditional transit providers to the open peering community. In that light, local IXPs operating under such arrangements have been positioned as a way to democratize Internet traffic and reduce dependence on larger, for-profit providers. That is also why the Internet Society (ISOC) has financially backed them with grants and technical support.
In terms of location, IXPs are usually hosted in carrier-neutral colocation data centers that lease power and rack space and provide the overall physical layer. The IXP furnishes the network layer. However, some for-profit IXPs own the overall infrastructure, but that is a capital-intensive operation difficult to replicate in most developing countries. Finally, the data center operator or owner is the IXP itself, as with Equinix. Here, however, the IXP’s interconnection neutrality is lost in the shuffle, as the operator is mainly a data center provider leasing services to all sorts of clients. Today, Equinix is one of the largest data center operators, and the IXP portion of the business is relatively small.
With that in mind, we can look at the data. While certainly incomplete, TeleGeography provides perhaps the best data on IXP distribution by country. PeeringDB is another critical source, but it relies on self-reporting by IXP providers. Large for-profit IXPs might not always have the incentive to keep records updated or report data at all. On the other hand, Peering DB has more data on small nonprofit IXPs regularly operating in developing countries, which are often eager to get listed to attract clients. I will thus be using TeleGeography.
I downloaded the IXP data back in June. TeleGeography offers a map and a full list of all IXPs sorted by IXP name on the side. Downloading the latter is not possible, so you will have to scrape the data, parse it, clean it and then generate your CSV file (or equivalent). One particular quirk is the wide variety of IXP names containing special characters, which makes parsing more challenging. Another issue is that data for the U.S., Canada and Australia includes state information in addition to city and country; that is missing from all other countries, so the data is not really tidy. I find this very odd.
The table below offers key descriptive statistics.
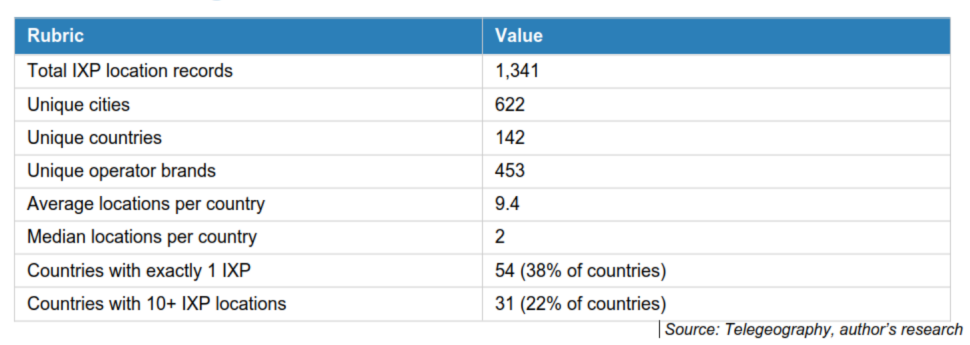
Here, we can already point out that the global distribution of IXPs is quite uneven. The difference between the average and the median is the best indicator. The “typical” country has one or two IXPs at best, and almost 40 percent fit that picture. The number of brand operators is a proxy for the legal entities—for-profit and nonprofit—providing IXP services worldwide.
So where are all these wonderful network facilities? The graph below shows the top 20 country locations, with WB income levels highlighted.
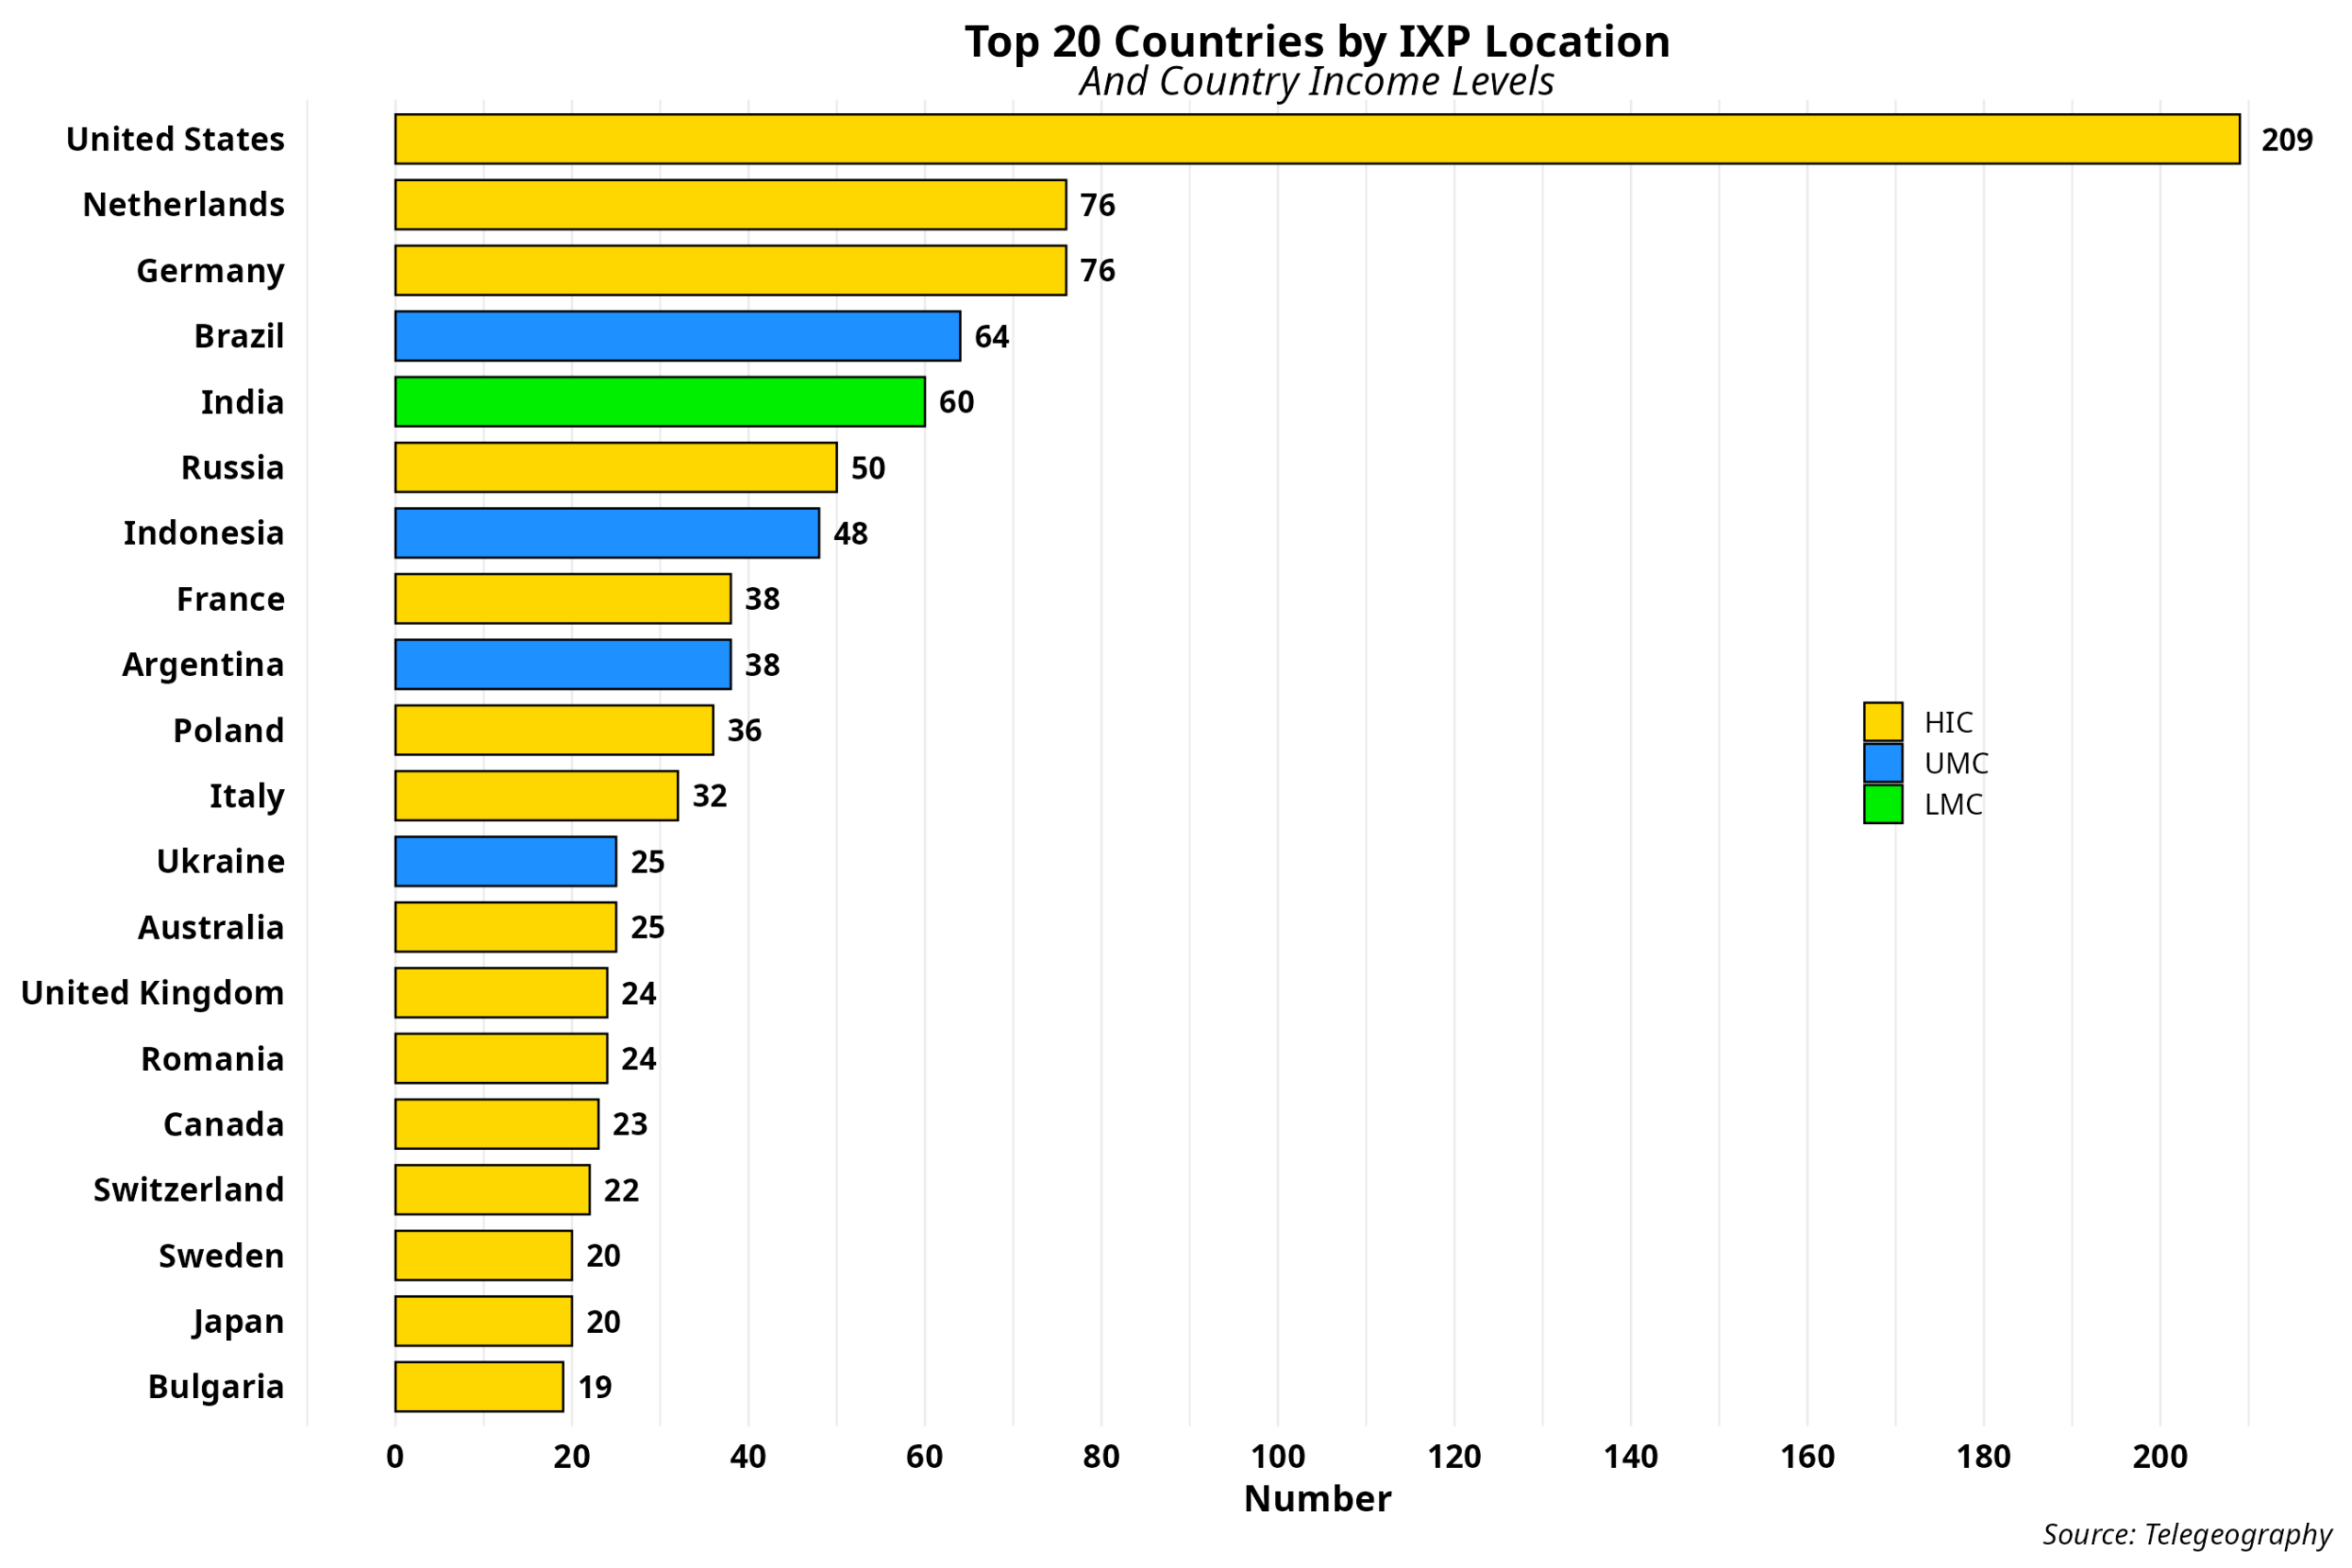
While most of the usual suspects show up again, Brazil, Argentina and Ukraine are the only upper-middle-income countries (UMCs) in the list. Furthermore, India is the lone representative from the lower-middle-income (LMC) group. India, Brazil and Argentina are among the top ten locations. The U.S. is the world champion yet again with 15.6% of the total. But that share is certainly not a solid indicator of sheer concentration and centralization. And, if we do the math by state, we see that IXP density in the country isn’t that deep. At any rate, the data add further information on the uneven development of IXPs. Most are in developed countries, while the rest hover around the median, with one or two IXPs per country.
Obviously, IXPs operate in cities, so the graph above is just an appetizer. The chart below lists the top 20 cities.
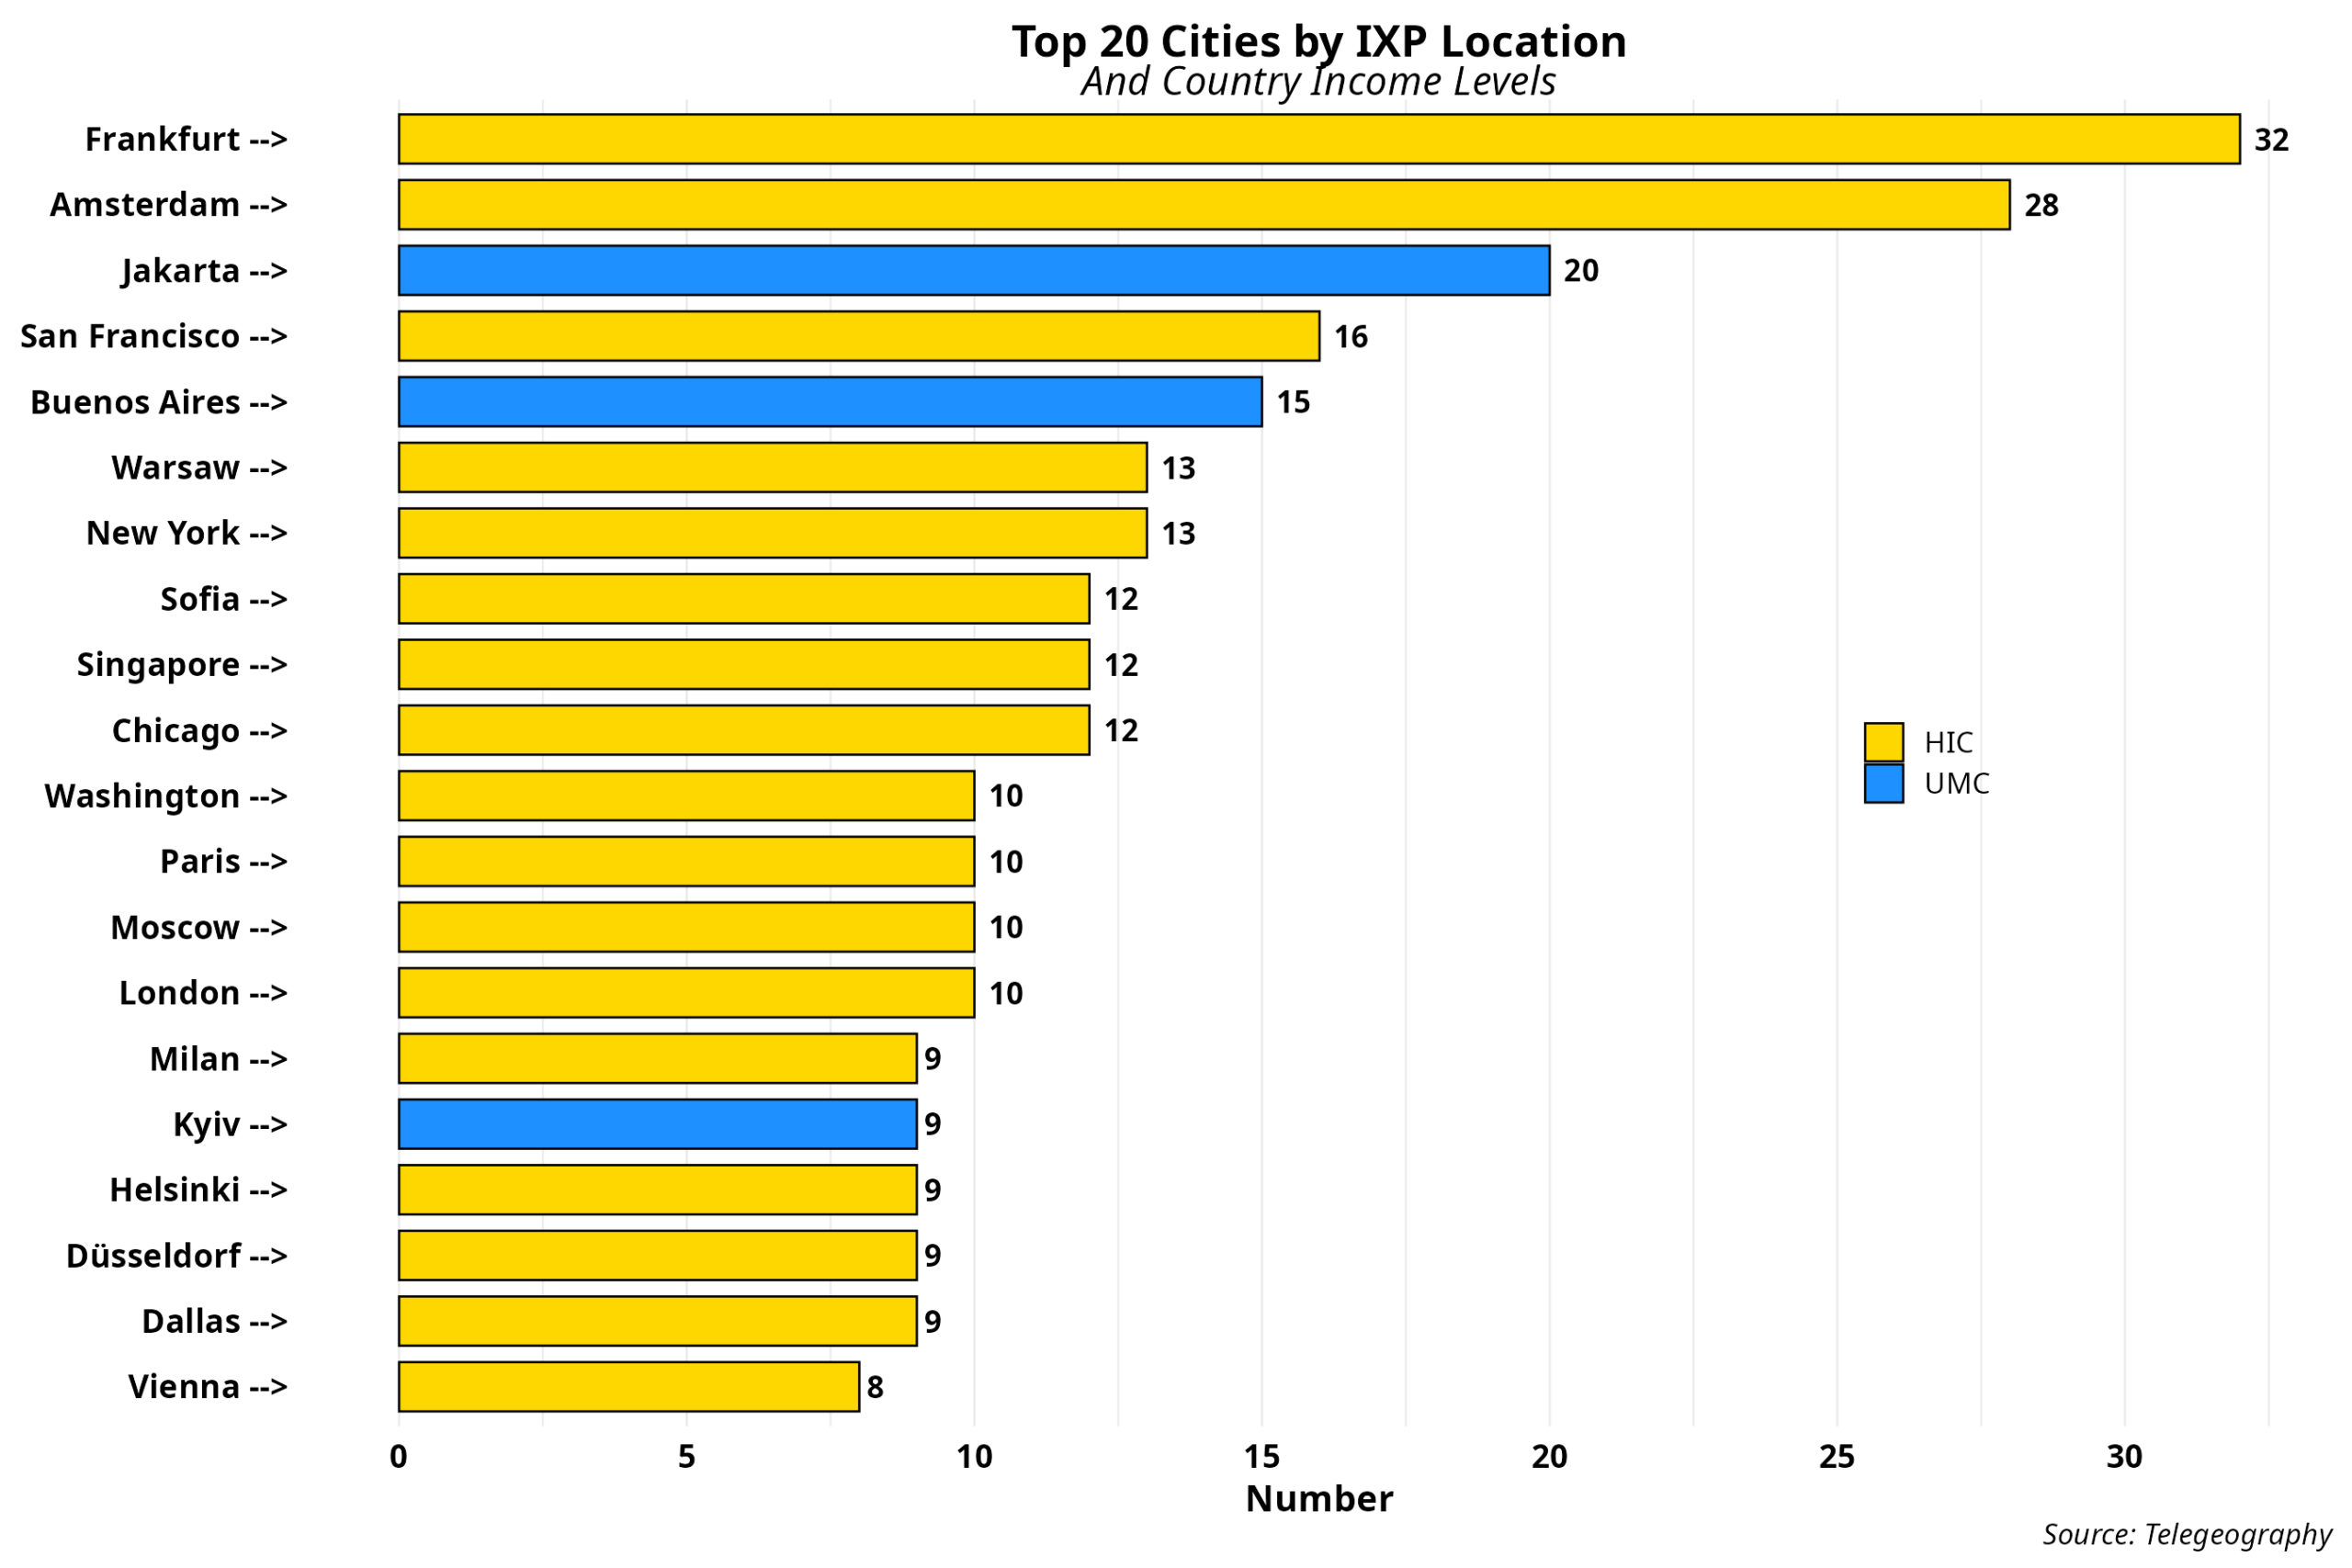
Frankfurt claims the top spot with 32, closely followed by Amsterdam. As noted in the previous post, these cities led the historical development of IXPs in Europe. The former hosts 41% of the German IXPs, while the latter represents 38%. Jakarta is a surprising third, outpacing most U.S. and European cities. That likely reflects the specifics of the Indonesian Internet market, where over 150 ISPs operate in a highly competitive environment. Buenos Aires and Kyiv are the other two cities from developing countries that make the cut.
Perhaps surprisingly, U.S. cities have a relatively discrete presence. While five are part of the top 20 (San Francisco, New York, Chicago, Washington, DC, and Dallas), none account for more than 7% of the country’s total IXPs. San Francisco leads here, but its share is less than 8%, unlike the European leaders. U.S. IXPs operate in 71 cities and 35 states. Half of the IXPs are run by for-profit companies, 45% are nonprofits, and 5% sit in academic environments. The largest commercial operators (Superloop, GPE, and Equinix, for example) are companies whose core business is data centers, fiber and networking, or telecommunications. They offer IXP services as an add-on and might charge little to no fee for port use, as long as the IXP pays for colocation or networking services.
For example, New York has 13 IXPs, 11 of which are for-profit. In contrast, Utah hosts only three locations, and all are nonprofits. This distribution further supports the hypothesis that IXPs are not high-profit business operations. This also helps explain why many IXPs in the U.S. are nonprofits. By the way, that is strikingly similar to the prevailing situation in many developing countries.
I have identified four types of IXP operators: 1. Private for-profit entities running IXPs as a business component. 2. Nonprofits, which include associations, cooperatives and nonprofit entities. 3. Academic. And 4. State-run, either government-owned or operated by a government entity. Identifying operator brands or parent entities required additional research, as the dataset does not include that information. We consulted corporate and operator websites, PeeringDB IXP profiles, ISOC IXP reports, and other sources. However, research gaps remained for several, so some numbers below are subject to revision.
That said, the graph below highlights the global distribution of IXPs by type.
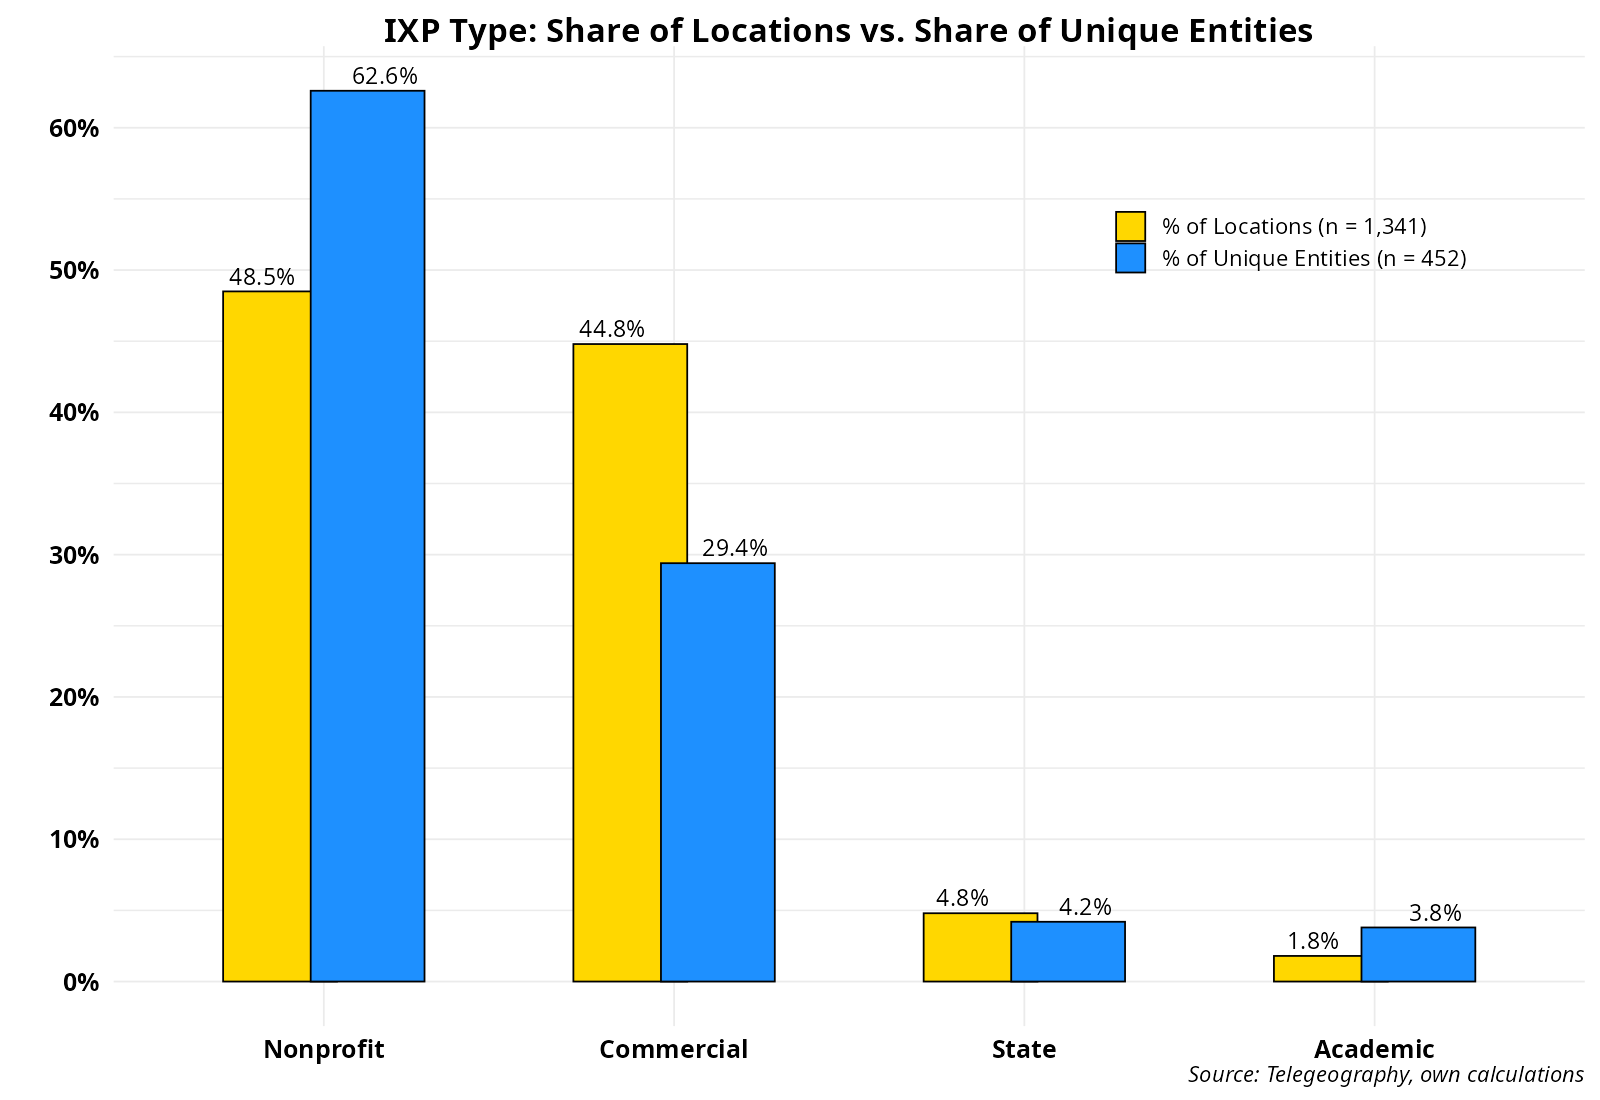
Nonprofit IXPs dominate globally in terms of both number and locations. In contrast, academic and state operators account for less than 5 percent of the total. More interesting is the ratio of entities to locations. While the ratio for nonprofits is 0.26, it is 1.98 for commercial operators, even though their market shares are almost identical. This suggests that commercial operators focus on the most profitable markets and cities where they can expand operations without incurring new fixed capital investments, while expanding the core non-IPX business lines, which yield much higher profit margins.
The table below shows the top 20 entities providing IXP services.
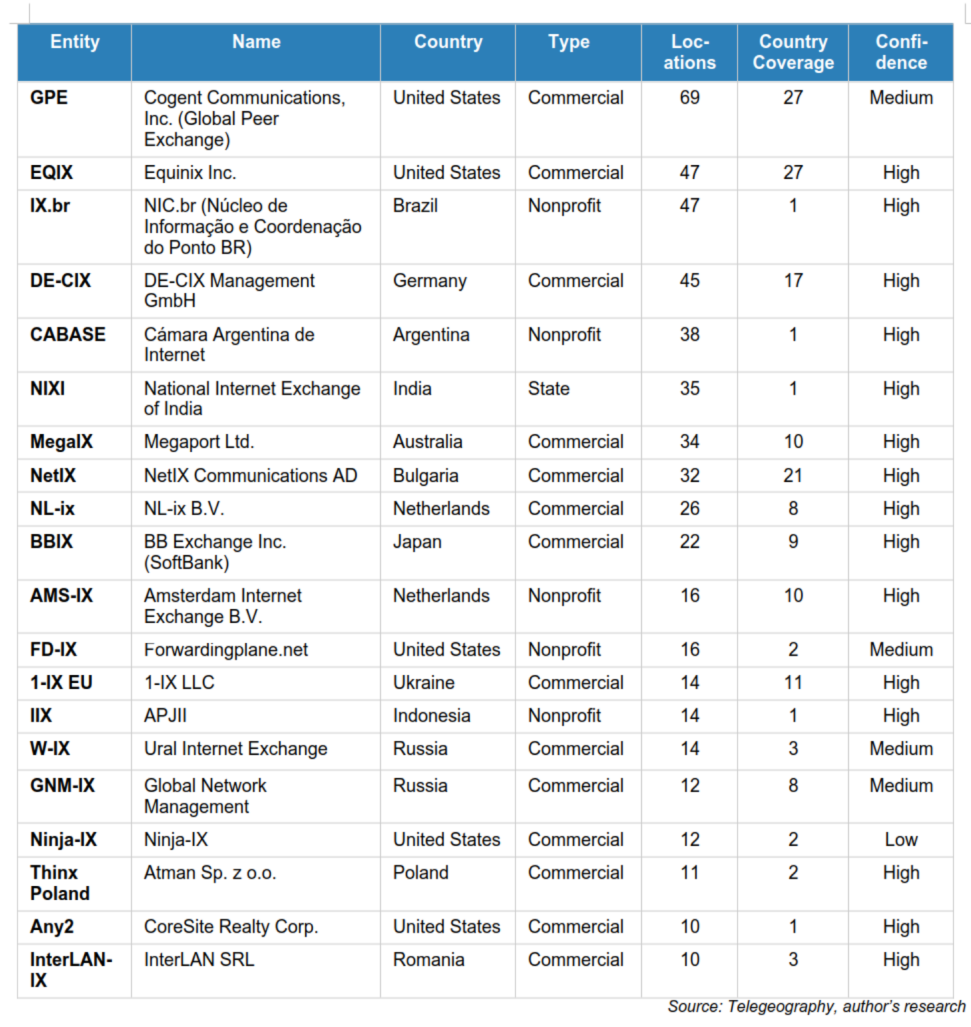
Country coverage depicts the number of countries where operators have a presence. The confidence column pinpoints the depth of my research. Entities with medium and low confidence indicate that further research is needed to confirm or change classifications and ownership. That does not affect the actual numerical data, however.
The top 20 IXP operators have a 39% market share (524 locations out of 1341). Fourteen are commercial, led by GPE, with Equinix trailing by 22 locations. Providers with 15 or more locations are all from developed countries. Notably, nonprofit IXPs from Brazil and Argentina are part of the top six. However, no single provider has a market share larger than 6 percent, so concentration and centralization by one or two firms are not taking place in the sector—at least not yet.
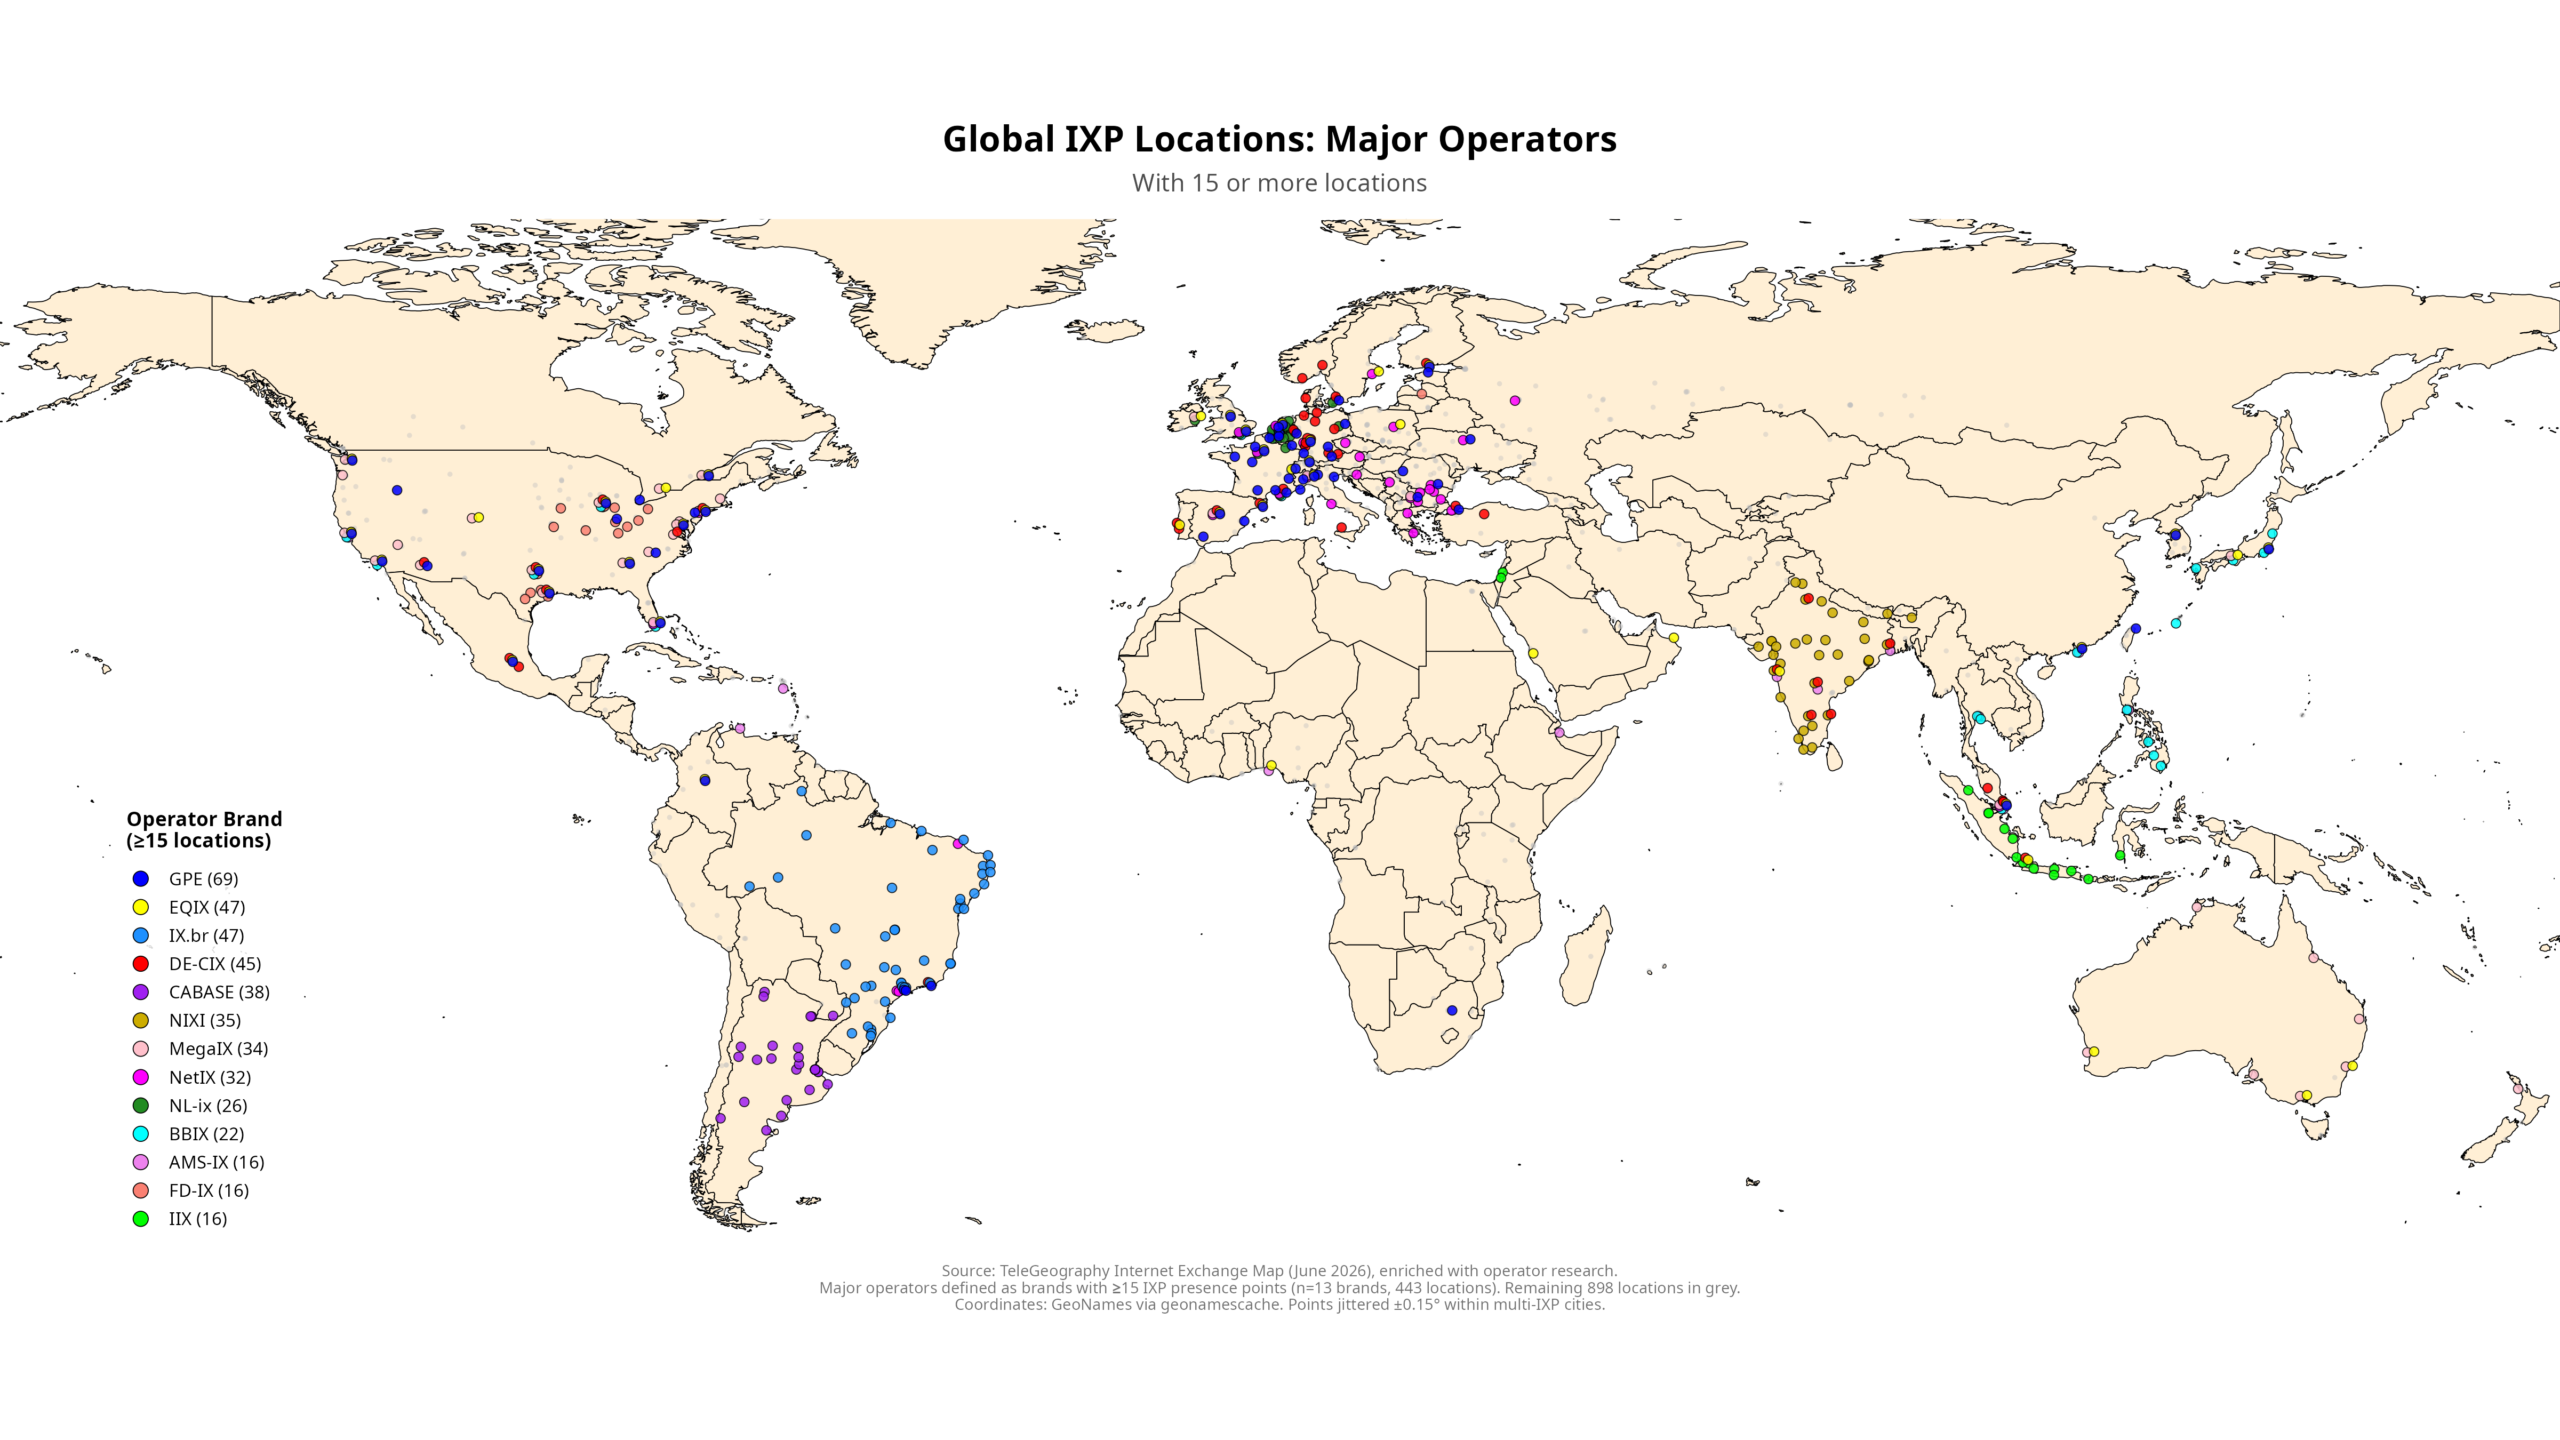
Perhaps the most interesting number is provided by country coverage, which seems to decrease for commercial operations as locations also decrease, except for Bulgaria. Nonprofit operators from developing countries have little international presence and thus function within the confines of their national states. That is certainly the case for Brazil, Argentina, India and Indonesia, but not for Ukraine and Romania, which can, in principle, easily cater to the European market, unlike the former.
The map below shows this predicament for operators with more than 15 locations.
Raul