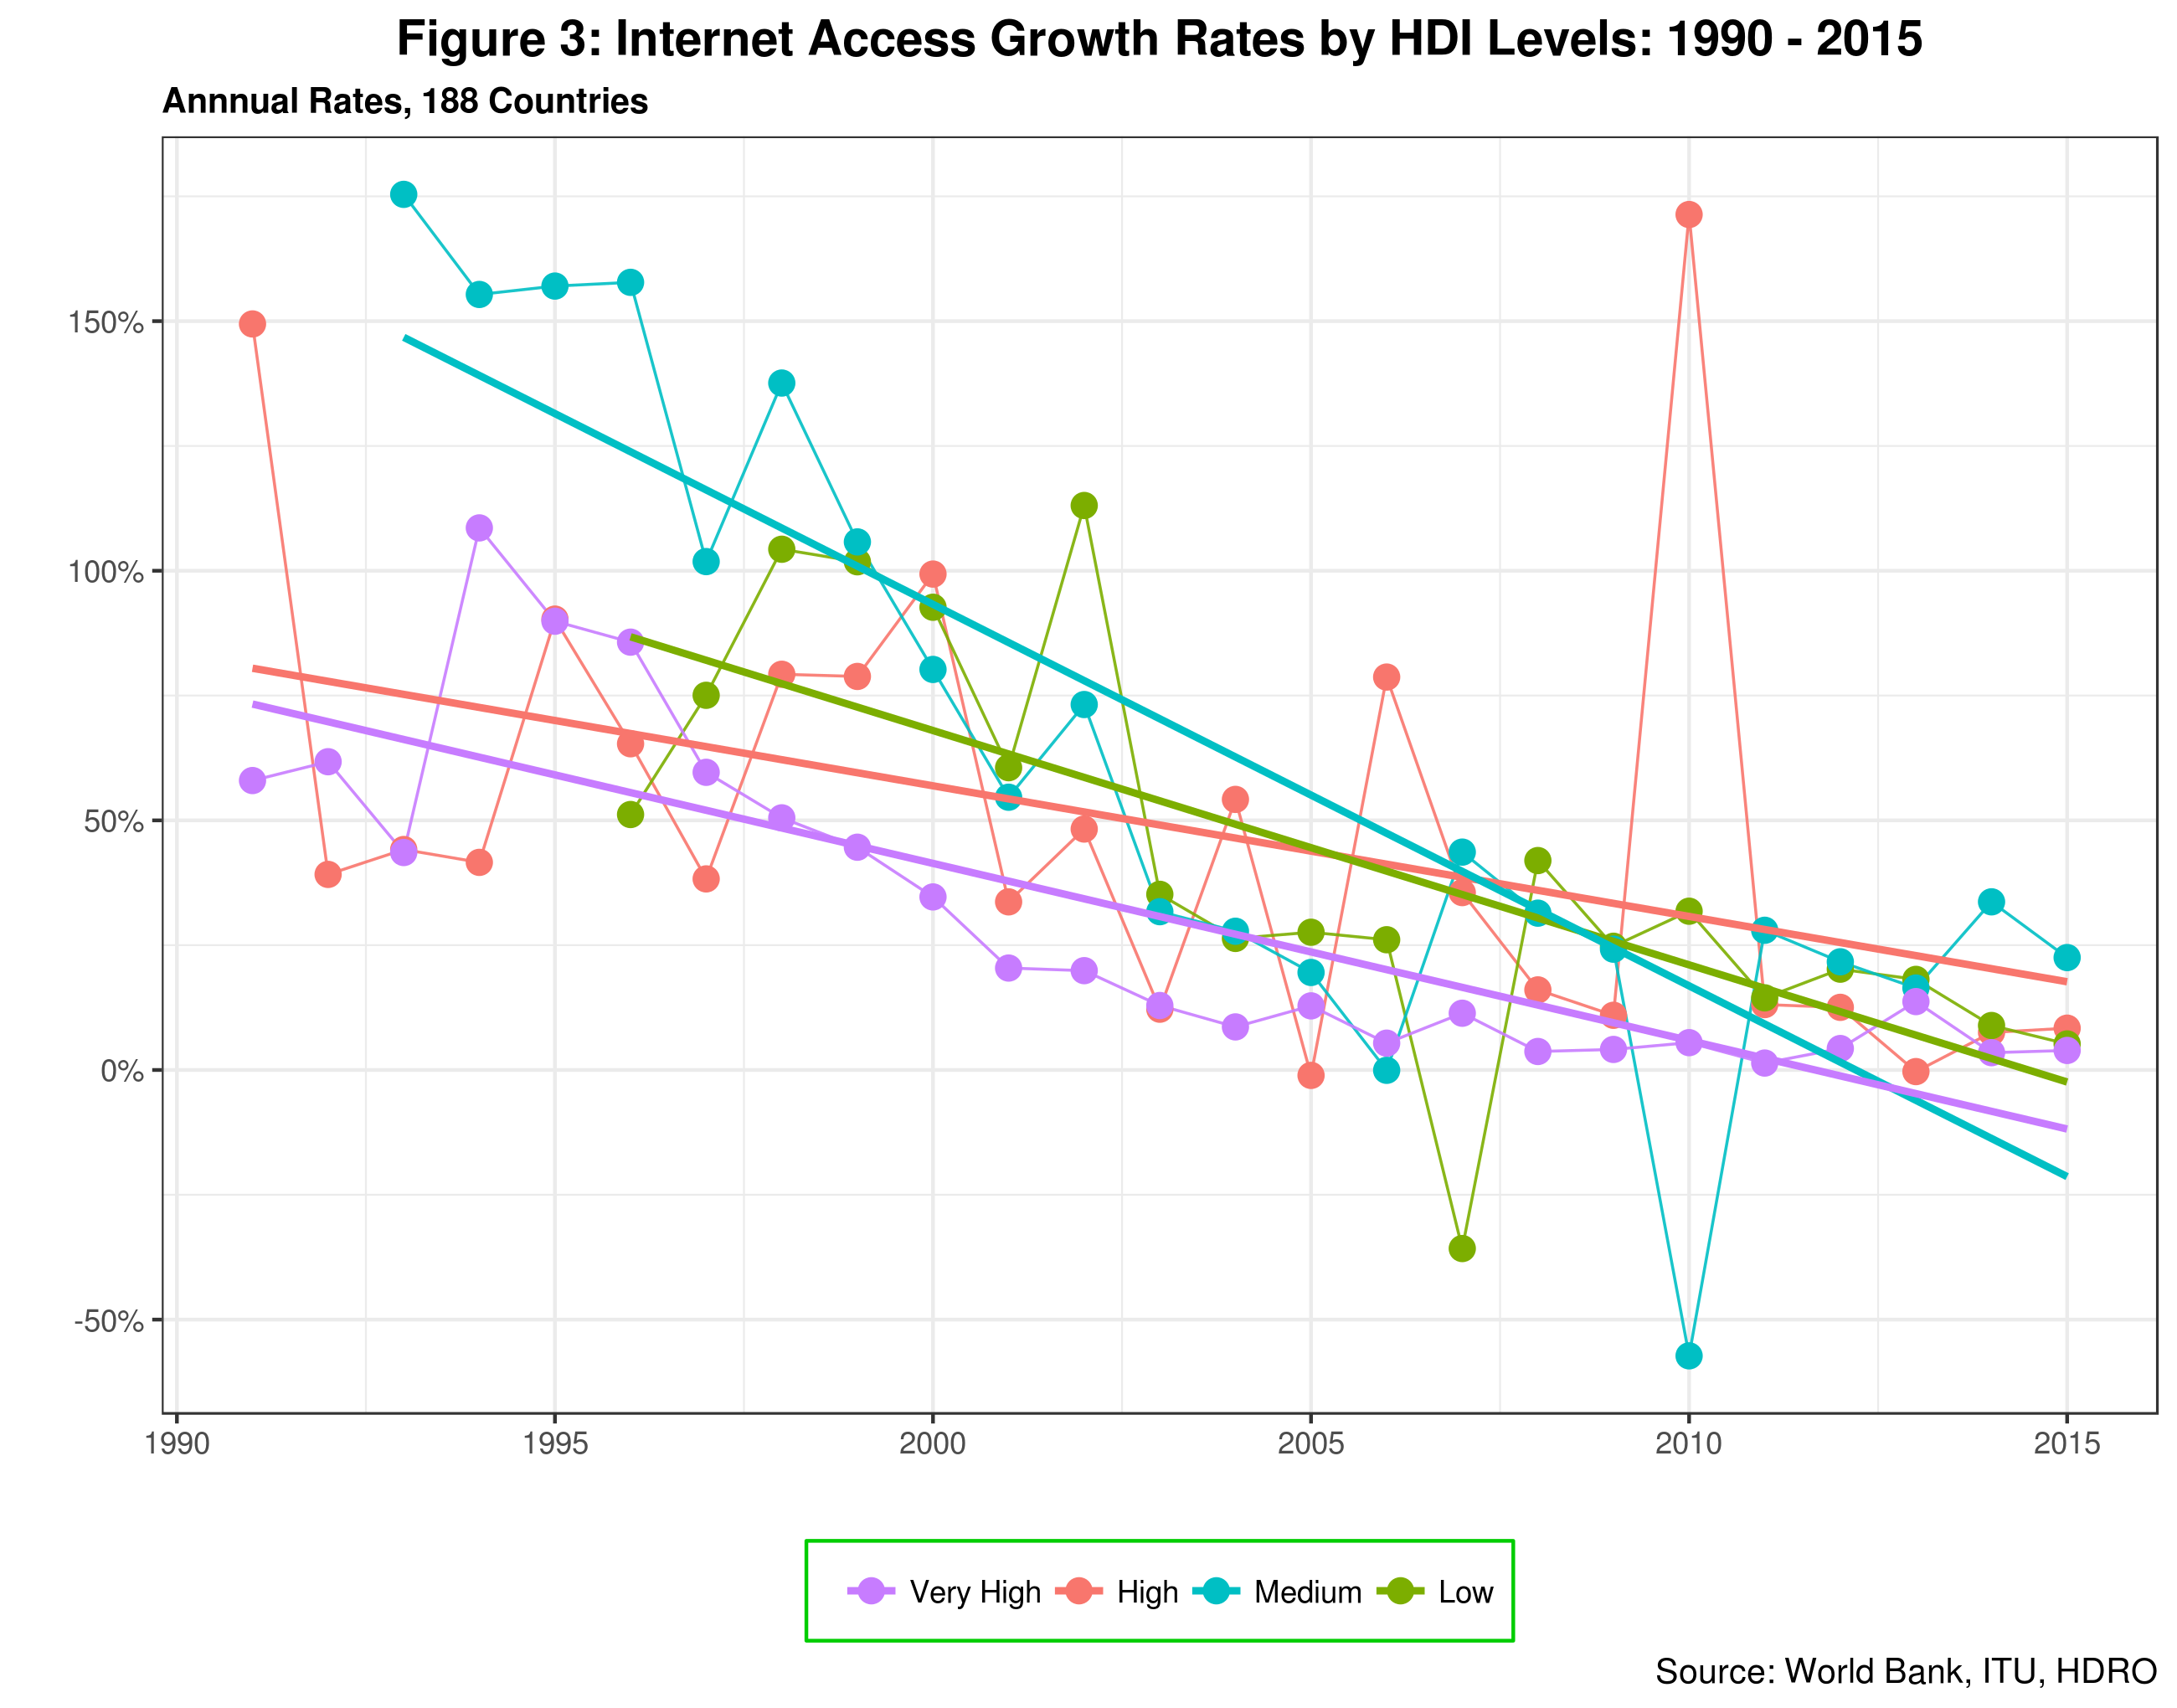
A recent news article nicely summarized efforts by Silicon Valley tech giants to close the so-called digital divide in developing countries. Not that this kind of initiatives is new – not at all. In fact, a plethora of projects and programs with a similar goal have been launched since the mid-1990s, with mixed results at best. Twenty plus years later, close to 60% of the world’s population is still not connected to the Internet. And Internet access growth rates for most countries are now converging around 7% per annum, down from double digits in previous years.1 While mobiles have spread faster in the Global South, the latest GSMA report suggests that growth rates in the sector are also slowing down due to the socioeconomic barriers this group of countries face.
One common trait these initiatives share is the assumption that the gap in Internet access is, for the most part, the result of weak or inexistent infrastructure. The answer: Deploy satellites, balloons, drones or other new technologies, and local users will join in droves. Indeed, the root causes of this gap cannot be reduced to one single factor. For poorer nations, gaps education, health, grid access, and poverty, to mention a few, introduce formidable barriers that also need to be explicitly addressed in parallel, if not sequentially in some cases, to close the access gap.
In a previous post, I highlighted the relation between Internet access and national income levels. While the latter does seem to play a role, the correlation between Internet penetration and national income is 0.566.2 Keep in mind that correlation is not causation! There is thus room to consider additional dimensions. In this post, I will explore the links between Internet diffusion and human development since 1990 using the Human Development Index (HDI) as core indicator.
In addition to national income data, the HDI includes indicators for both education and health. In other words, it adds two additional dimensions to the equation. The table below presents country distributions and population share by HDI levels.3 Check page 3 of this document for the current definition of HDI levels.
| HDI Level (2015) | Number of Countries | Share of total global population |
|---|---|---|
| Very High | 51 | 18.7% |
| High | 55 | 32.6% |
| Medium | 40 | 36.1% |
| Low | 41 | 12.7% |
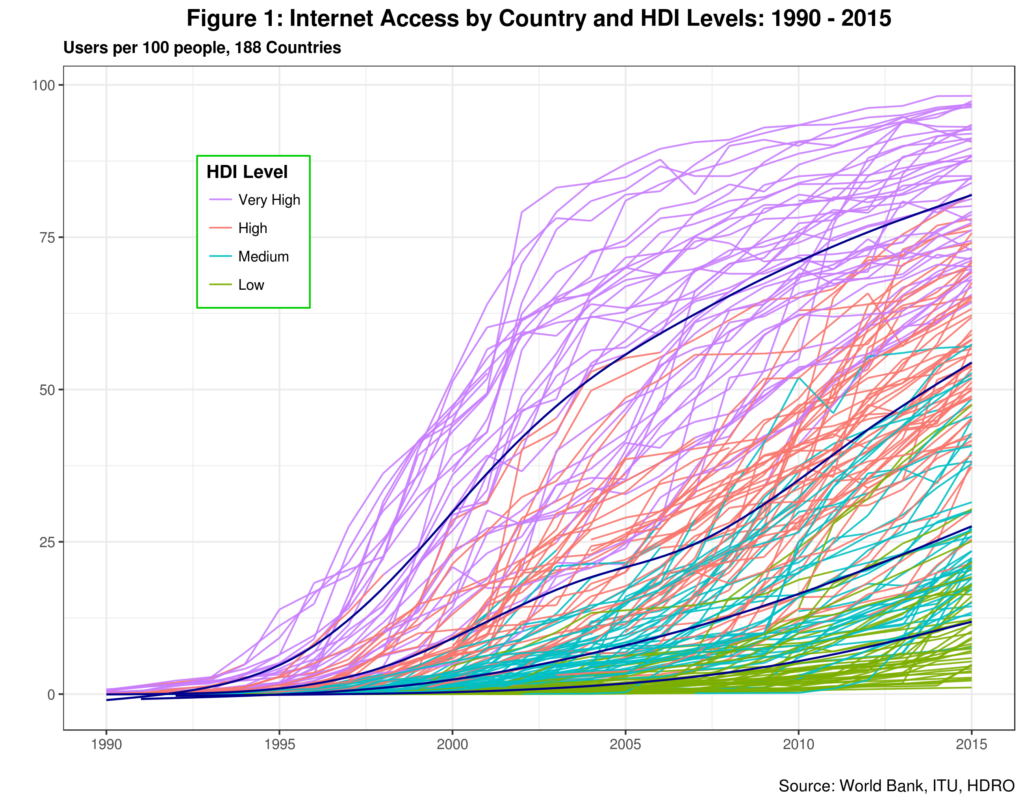
Figure 1 depicts the evolution of Internet for 188 countries by HDI levels. The graph also includes a polynomial trend line for each of the four HDI categories.
 First, a high correlation between Internet penetration and HDI level can be seen: the vast majority of countries belonging to each and every HDI level evolve similarly. But they are also clear exceptions. Not surprisingly then, the correlation coefficient is 0.660 which is almost 17% higher than the one estimated for national income but still leaves room for improvement. Second, note the country dispersion within each HDI level. High level (HL) countries have the largest distribution with some being early adopters and quite a few joining the fray late in the game. Regarding trends, countries with both very high (VHL) and HL seems to follow the well-knows S-shaped pattern associated with technology and innovation diffusion. That is certainly not the case for countries in the other two categories that appear to be just at the take-off stage. Fourth, and related to the previous, note the speed of diffusion. Countries with low HDI levels (LL) have a hard time reaching say 30% Internet penetration, whereas the other group of countries has all already crossed 50% penetration.
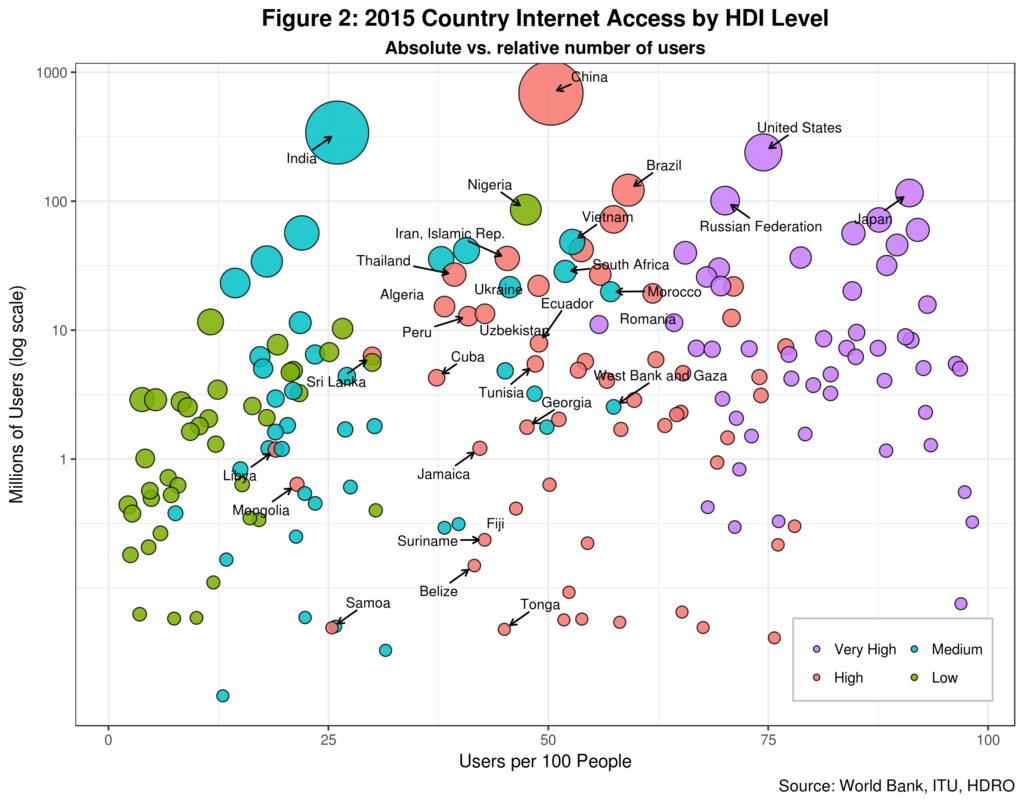
 The latter can be better appreciated in figure 2 which compares absolute to relative Internet population. The size of each bubble represents the total country population. For starters, all VHL countries have already crossed the 50% penetration threshold. In fact, Romania is the only country in this group with less than 60% Internet diffusion. On the other hand, not one single country with LL has crossed the 50% threshold. Only Nigeria is approaching such limit with 47% while all the rest are below the 30% mark.
The dispersion of HL countries is clearly depicted in the graph. Diffusion rates oscillated between 78% (The Bahamas) and 19% (Lybia). And perhaps surprisingly, countries such as Ecuador, Georgia, Iran, Jamaica, Peru, Thailand, and Ukraine have yet to reach 50% penetration. Finally, very few countries in the Medium HDI Level (ML) cohort have crossed the 50% threshold. Morroco, South Africa, and Vietnam are included here. However, most ML countries are lagging behind with quite a few performing worse than those in the LL category.
In sum, using the HDI instead of the more traditional GDP indicator to analyze Internet diffusion sheds some new insights. Levels of education within countries are indeed correlated with Internet use. Same goes for health.
However, this analysis also highlights the complexity of the issue which cannot be explained by one single variable, in a one-dimensional fashion. Which brings us back to the issue of infrastructure. Efforts solely focus on providing access and connectivity will not be sustainable in the medium term if not complemented with initiatives that foster overall human development in all those countries where Internet diffusion is lagging behind. In the end, the real power of the Internet is not just connectivity. Rather, its real power relies on its potential to enhance human development across the board.
Endnotes
| ⇧1 | While mobiles have spread faster in the Global South, the latest GSMA report suggests that growth rates in the sector are also slowing down due to the socioeconomic barriers this group of countries face. |
|---|---|
| ⇧2 | Keep in mind that correlation is not causation! |
| ⇧3 | Check page 3 of this document for the current definition of HDI levels. |

