In the previous post, I detailed some issues that could help explain in part the gender-equality STEM paradox.
Recap
These can be summarized as follows:
- The Global Gender Gap Index (GGGI) measures gaps not levels. It is thus a relative indicator that takes stock of the gender gap regardless of the level or depth of development.
- The four GGGI subindices cannot be larger than 1. Thus, the GGGI does not factor-in cases where women are ahead of men. This is related to the previous point: the aim is to measure gender gaps, not gender levels.
- As of 2015, UNESCO STEM data is only available for 59 of the 144 countries included in GGGI. That is, almost 60% of the states are missing in the analysis of the gender-equality STEM paradox. Many low-income and lower-middle income countries are not part of the WEF gender report. This undoubtedly introduces a bias in the statistical analysis given the relatively small sample size and the uneven country coverage regarding income levels.
- In addition to the STEM paradox, we also found that the GGGI and two non-STEM areas are also negatively correlated. But in all cases, such correlation seems to be statistically insignificant.
- Analysis of non-STEM data also suggests a “gender-equality non-STEM paradox” as countries with lower GGGI have more substantial female participation in such areas.
Squeezing the Data
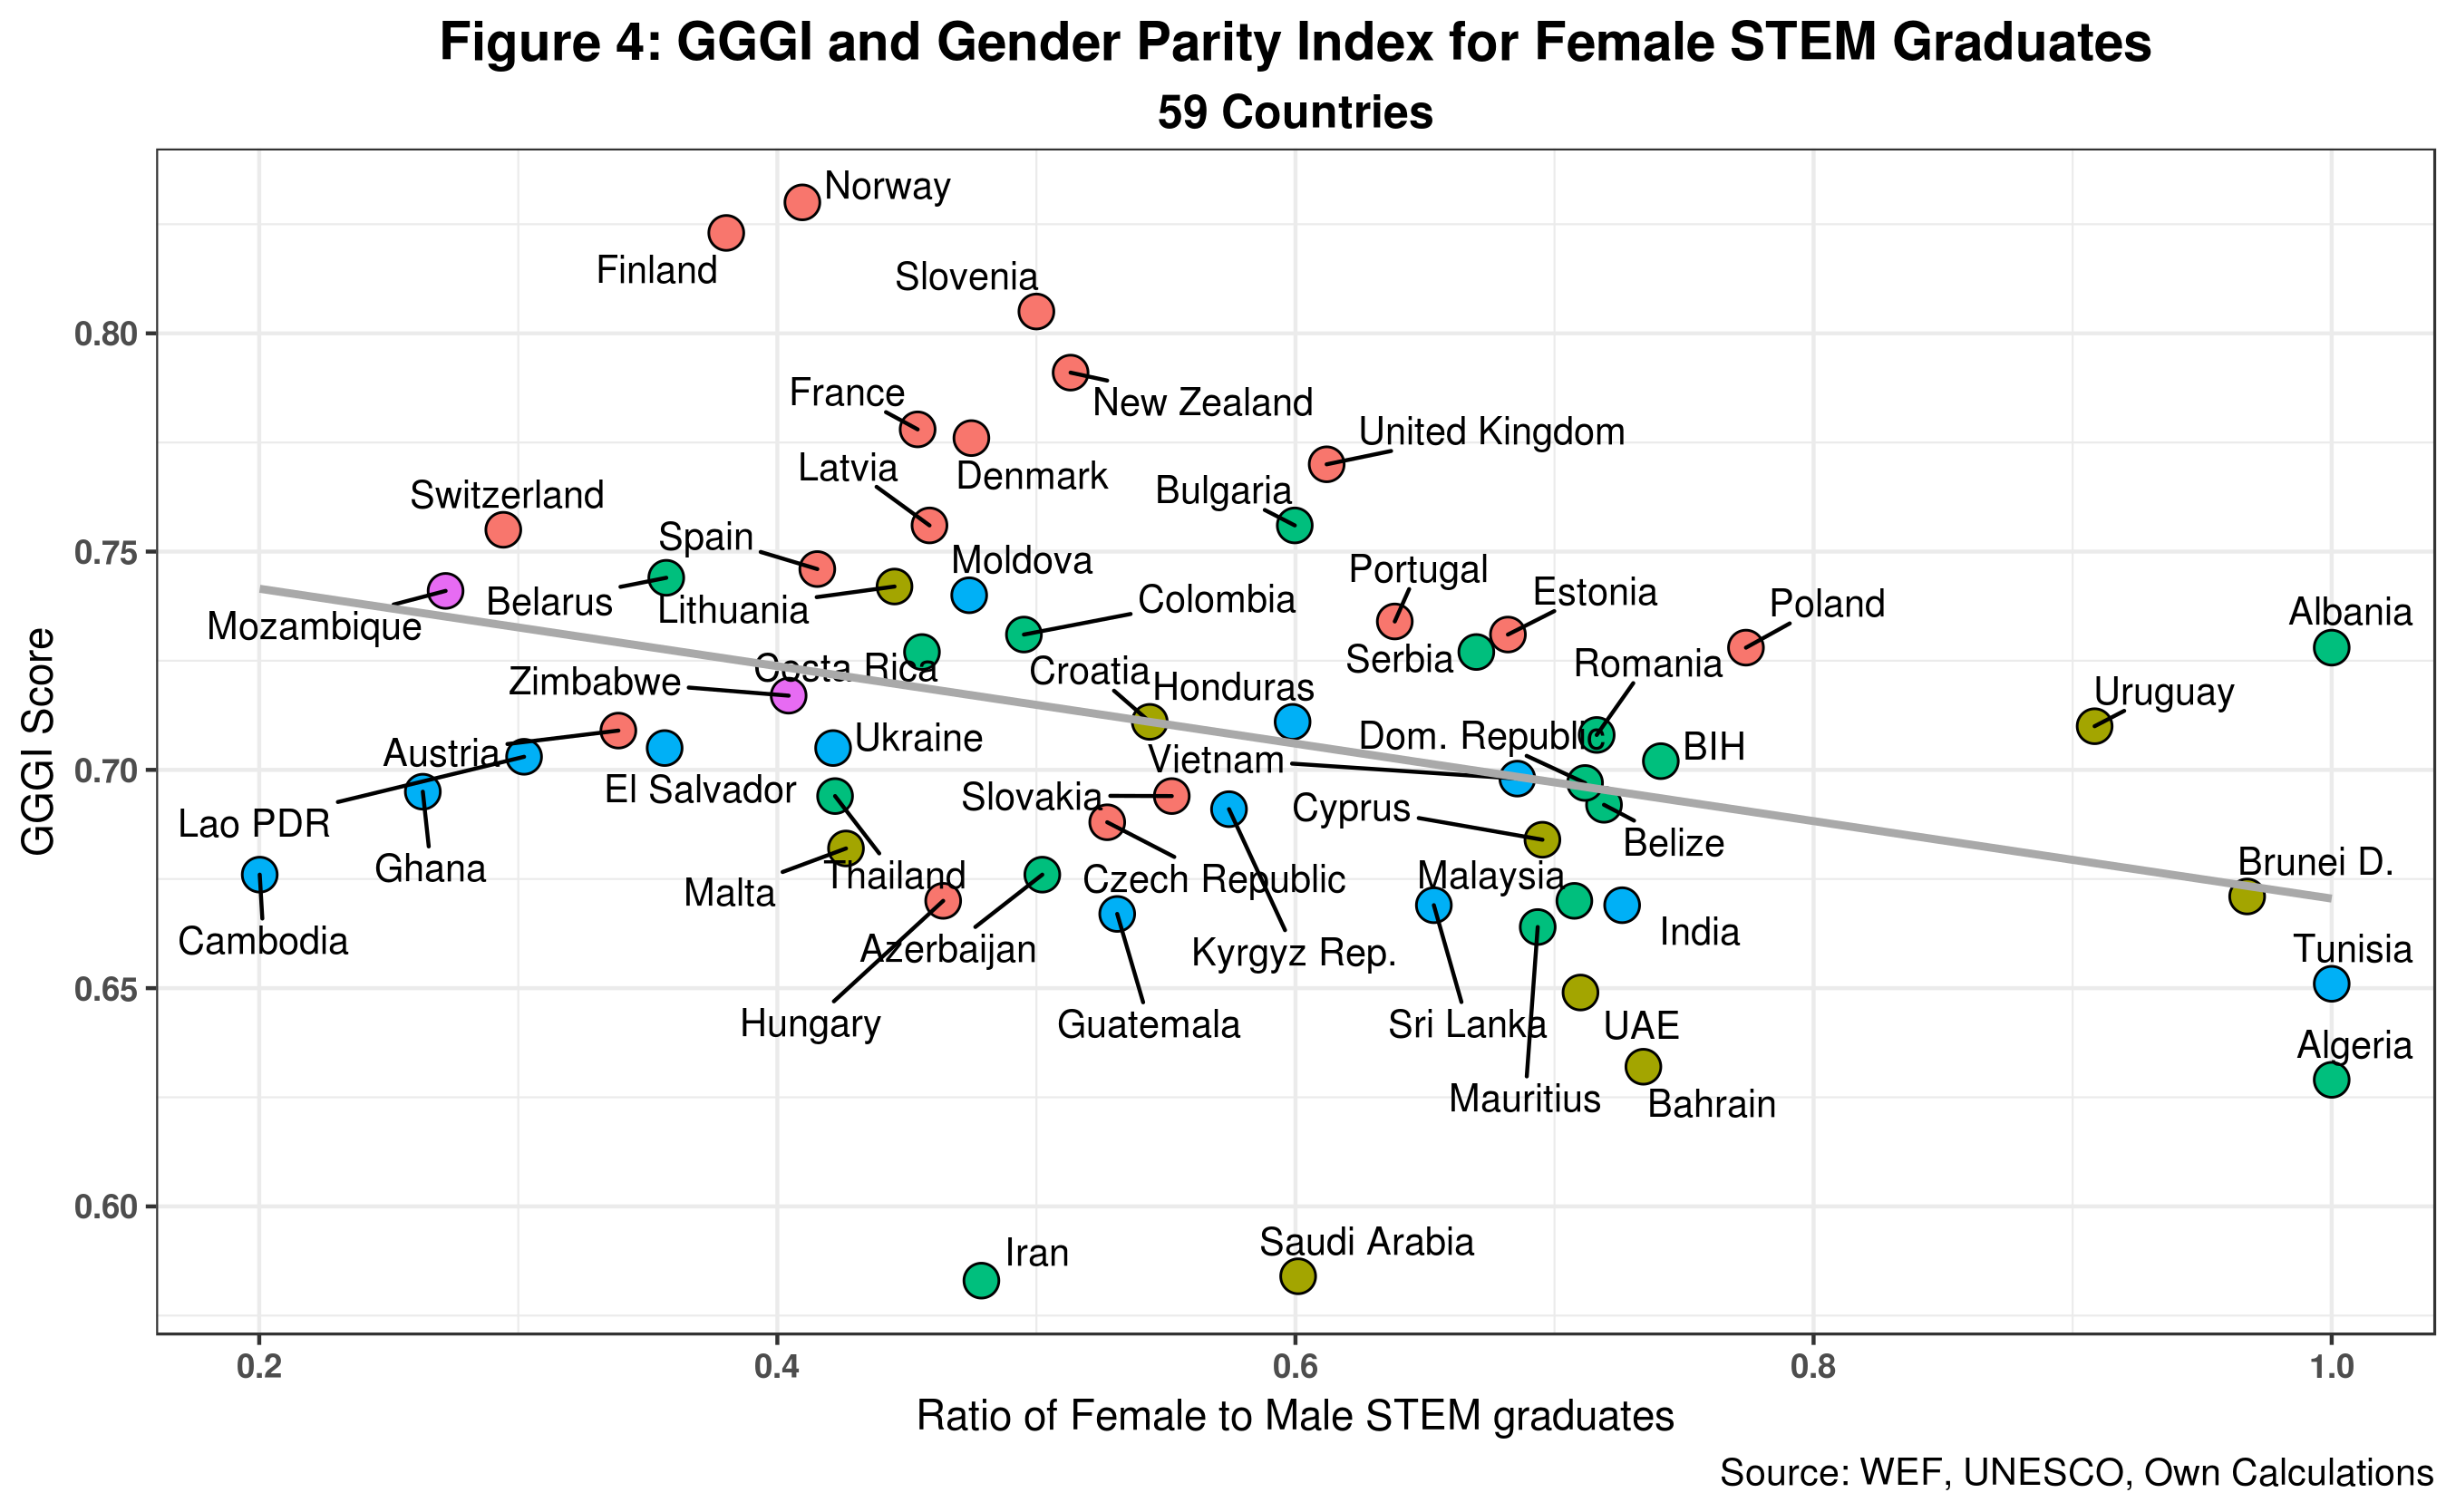
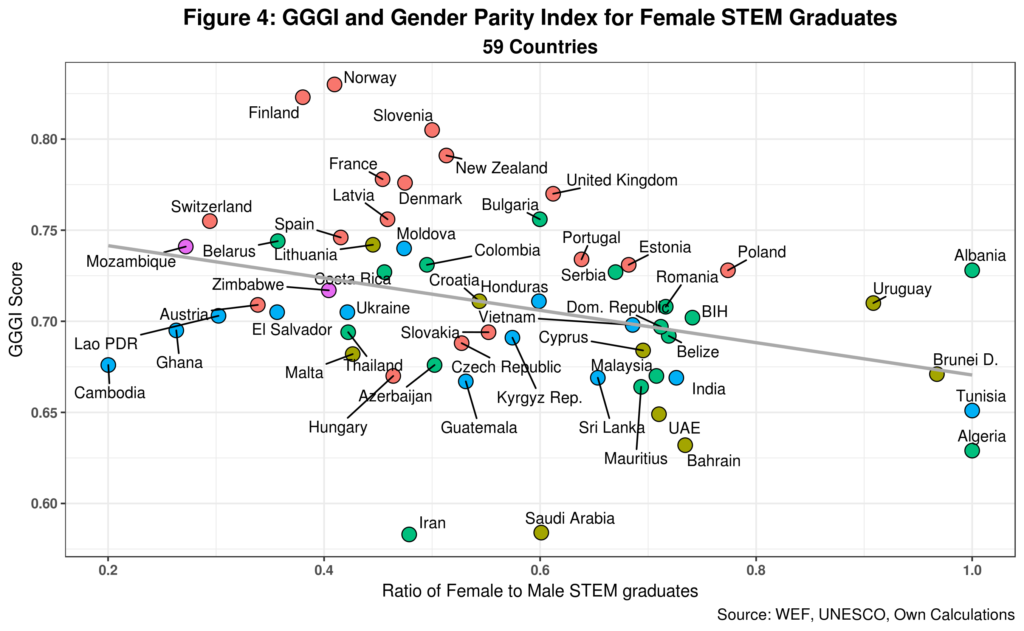
Points 1 and 2 can be used to improve the original paper graph depicting the paradox. Such chart is, in fact, comparing a gap measure, the GGGI, with a level indicator (the percentage of female STEM graduates) which is not strictly accurate. Instead, we should compare the GGGI with the gender gap in STEM graduates. Moreover, following the same methodology as the WEF gender report, we should ensure the STEM gender gap does not go over 1. I did the required estimations which are presented in figure 4. Note that three countries, Albania, Alegria and Tunisia report no gender gaps in STEM graduation rates while 54 countries do not cross the 80 percent threshold. Surprisingly, Switzerland, Austria, and Finland do not even reach the 40 percent threshold. On the other hand, the main finding of the paper still survives.
UNESCO data for education enrolment at all levels includes an indicator called the Global Parity Index (GPI) which is estimated in the same fashion as the various GGGI subindices: the ratio of female to male enrolment in primary, secondary and tertiary education. However, the GPI can be larger than 1. Figure 5 depicts the relationship between the GPI for tertiary education and the GGGI. I have excluded Qatar as it reports a GPI of over 6 and is thus an outlier. The data covers over 100 countries.
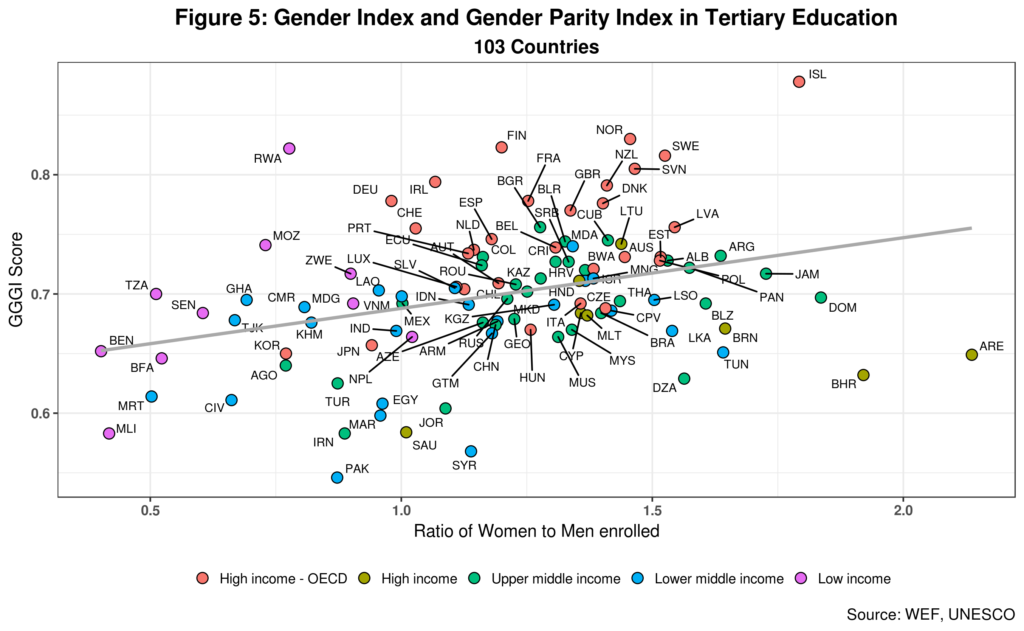
No paradox here as the correlation between the two indicators is positive. Albania, Algeria, and Tunisia have GPIs bigger than 1.5 but are not lead performers as was the case in figure 4 above. 78 countries representing 76 percent of the total report a GPI of 1 or larger which means that there is no gender gap when it comes to female enrolment in tertiary education. Korea and Japan are notable exceptions here. But perhaps the most crucial point is that while tertiary enrolment gender gaps in most countries in the sample are not pervasive, countries with lower GGGI scores have relatively more women enrolled in the sector, except for Iceland. This evinces that levels can help explain in part the female STEM gap paradox.
To explore this assumption, I created figure 6 which compares female vs male enrolment in tertiary education. I have excluded Australia as it reports a large female enrolment ratio and is thus an outlier.
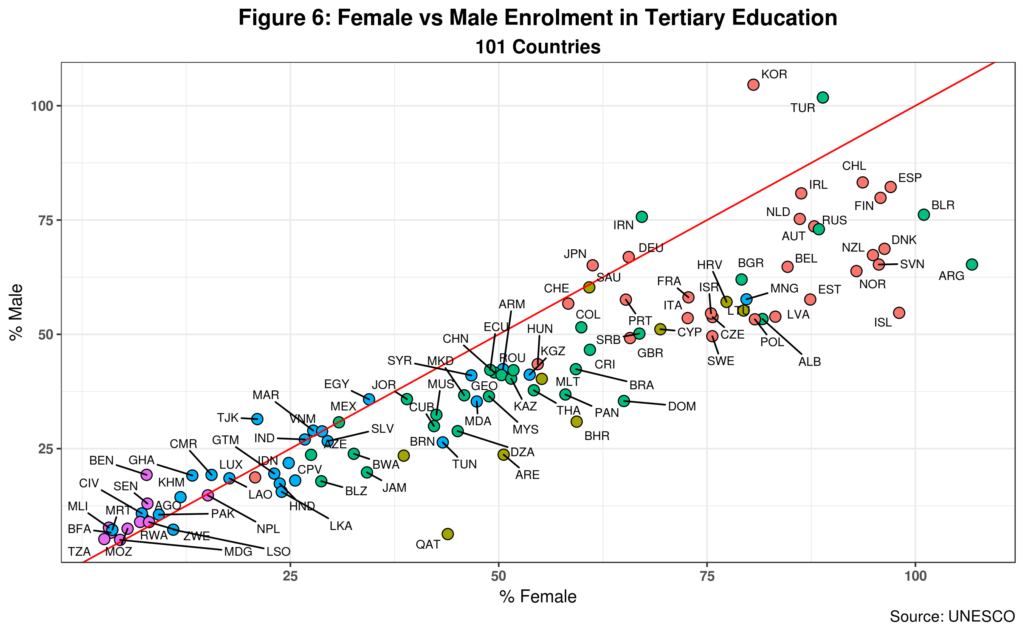
The red 45-degree line divides countries according to gender enrolment. Dots to the left of the line represent countries where males top enrolment. And those to the right is where women take the lead. In an ideal world, most countries should be close to the 45-degree line and in the upper right quadrant of the chart – assuming the normal gender distribution is 50-50. This is undoubtedly not the case. In most countries, enrolment is led by women.
But the graph also reveals a key point about levels. Recall that Qatar had a GPI of over 6 (or six females per every male enrolled in tertiary education). But note that total female enrolment in the country is around 43% while only 6% of men register in tertiary education. A similar point can be made for both Tunisia and Algeria which, as we saw above, report no STEM gender gap. Albania might be slightly different as enrolment for both sexes is over 50% but men just barely cross that line while over 82% of women are registered in the sector.
We can thus conclude that, on average, countries with a high GPI are also those reporting lower Female STEM gaps (and non-STEM too!). This is even more evident in countries where the overall level of registration is relatively small, usually below the 50% threshold. We should of course not assume that enrolment is the same as graduation rates. Indeed, there is evidence out there that women who enroll in STEM tend to switch to other areas within one year. However, using the GGGI to analyze the gender-based STEM gap is less than ideal as by default the index ignores levels.
Summing-up
Admittedly, we cannot expect data alone to explain the gender STEM gap. That is not my goal. Instead, I am trying to show the limitations of using data to do so. And here, the subtle distinction between gaps and levels makes a big difference. But that is only part of the equation.
UNESCO has recently published a comprehensive report (PDF) on the gender STEM gap which provides an excellent overview of the subject. Having worked in the tech sector for many years, I have seen the gap in action, still alive and kicking today in booming areas such as artificial intelligence and blockchains. But things are changing…
Cheers, Raúl
