
The Bitcoin bulls are back in full strength, driving the price of the cryptocurrency to unprecedented heights. The digital currency is now approaching 50k. Nevertheless, pundits and fundamentalist supporters still see the sky as the only possible limit. Go figure. One thing is certain: Bitcoin is now entering the mainstream financialization push that has been overtaking the global economy in the last few years.
In a previous post, I examined the distribution of addresses/wallets and wealth within the Bitcoin economy back in 2018. How has the recent upsurge changed my initial findings – Bitcoin being the most unequal “country,” wealth-wise? To answer this question, I will introduce the concept of classes as defined by Stephen Rose for the US economy, using Bitcoin balances as a proxy. Rose defines five classes based on income levels of families comprised of three people. Those earning less than $32,500 are poor or near-poor (PNP). The lower-middle-class(LMC) follows with a maximum income of $54,500. The middle-middle-class (MMC) is next and stops at $108,500. The upper-middle-class (UMC) covers incomes as high as $380,500. And the rich are all those with incomes higher than the former.
Bitcoin balances are reported in ten categories ranging from 0.001 to 1 million coins. Matching then with Rose’s classes is thus not straightforward, so I will make additional assumptions. First, I will freeze Bitcoin’s price at 40k. All those who own one Bitcoin or less are thus part of the PNP and the lower section of the LMC. I define this group as my lower-class (LC). Those with balances between 1 and ten Bitcoins are part of my middle class(MC), which merges Roses’ LMC, MMC and UMC. And the rest are just the very rich Rich or the upper class (UC). So we end up with three classes under my simplifications. I also assume that income is a great proxy for wealth in Bitcoin nation as it is not a work-driven economy. It is financially driven and owning the asset is much more desirable than using it as a medium of exchange. I also assume that each address/wallet is one individual -albeit we all know that many of the richest wallets are owned by so-called “whales” comprised of institutional investors instead. Individuals can also have more than one address/wallet. I ignore both of these in my analysis.
The first thing to check is the overall changes in the Bitcoin economy, depicted in Figure 1.
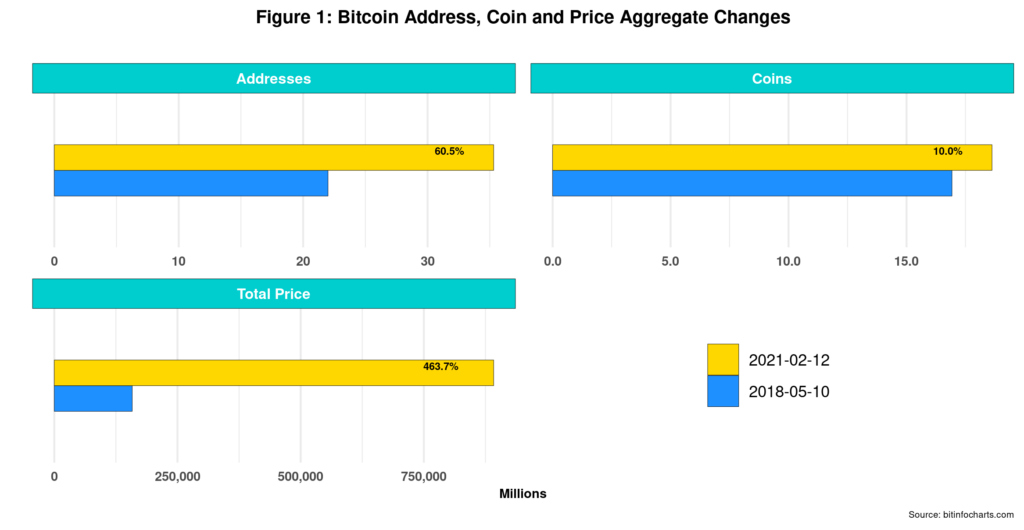
While price growth is almost 500% (and very volatile), Bitcoins’ population has increased by 60% in three years. The money/asset supply, limited by the platform itself, has been growing within expected boundaries. As wealth is evolving faster than population growth, we can conclude that all classes, considered one block each, are wealthier than three years ago. Next, we can take a peek at changes by class.
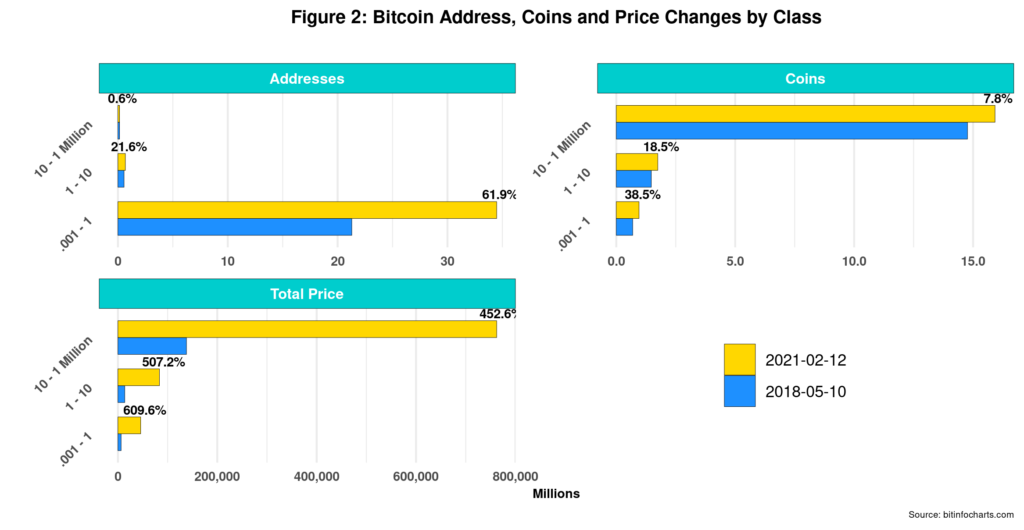
Figure 2 confirms our observation of overall class wealth increases, LC apparently being the main change engine in all three rubrics. Population growth is higher in the LC, as is the case in most countries. That indicates that access for newbies to the Bitcoin economy is more feasible at the lower levels of wealth. However, the rate of population growth in both LC and UC is higher than that of their respective portfolios, whereas the UC is just the opposite. So while wealth has increased in all classes, average individual wealth has, in fact, decreased. Average balances have decreased by 15% for LC and 2.7% for MC. The UC is having a ball, yet again, with gains of 6.7% per address. Finally, both coin and price distributions by class show that Bitcoin lacks a solid middle-class usually the largest in industrialized countries. Instead, Bitcoin seems to be part of the Global South given its class structure, LC being the most dominant.
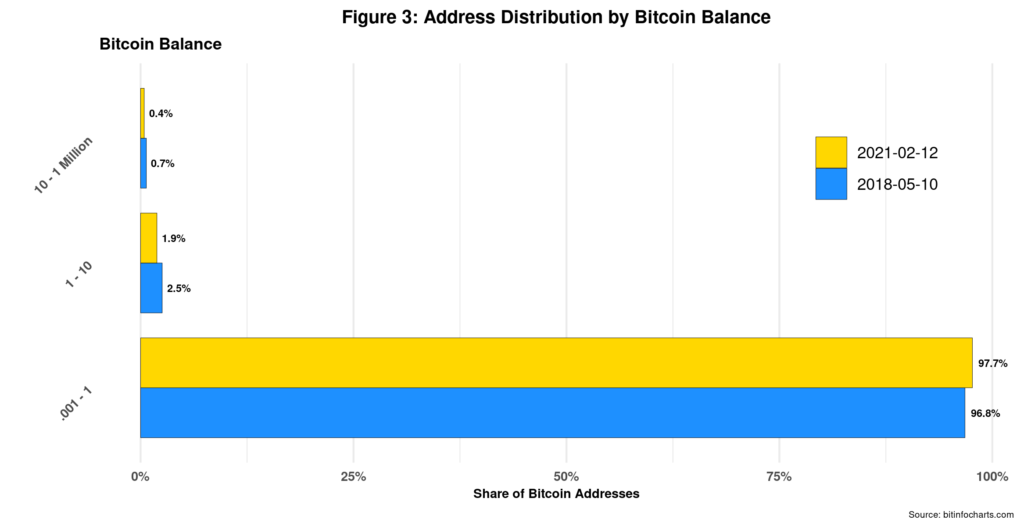
Figure 3 above quantifies such peculiar social stratification. Relative population growth is only taking place within the LC as both MC and UC have suffered relative declines. That is perhaps a reflection of the lack of social mobility within the three classes and the barriers of entry into the Bitcoin economy that aspiring new members face de facto.
The good news is that relative wealth distribution has improved in three years, albeit slightly, as shown in figure 4.
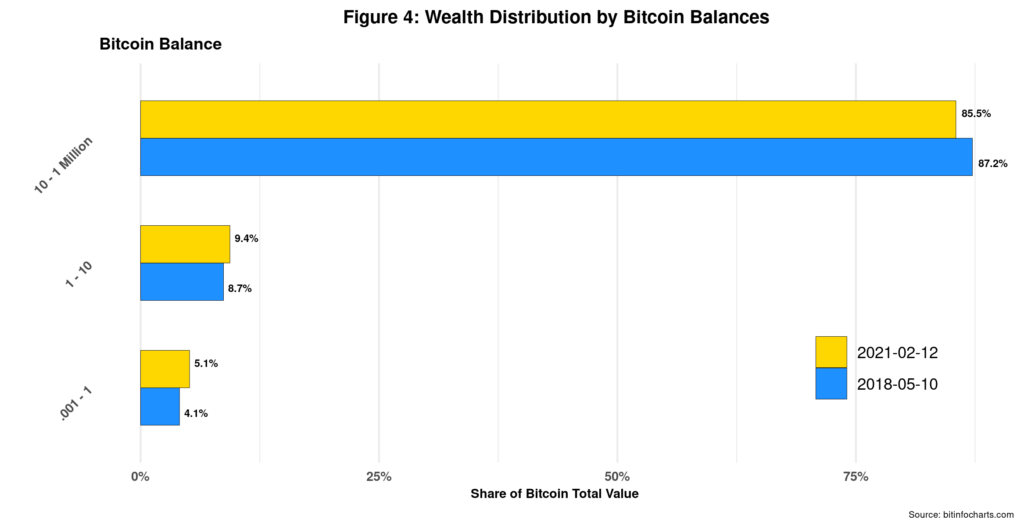
As wealth is increasing faster than the population thanks to the ongoing Bitcoin bubble, the potential for both LC and MC to increase relative to overall wealth is possible, especially if population growth is driven by the LC. However, their combined gains are only 1.7%, LC taking the largest chunk with 1%. It could be worse, that is for sure.
All in all, the Bitcoin nation still continues to shine as one of the most unequal in the world. Figure 5 presents a modified Lorenz curve depicting current wealth inequality between the three classes.
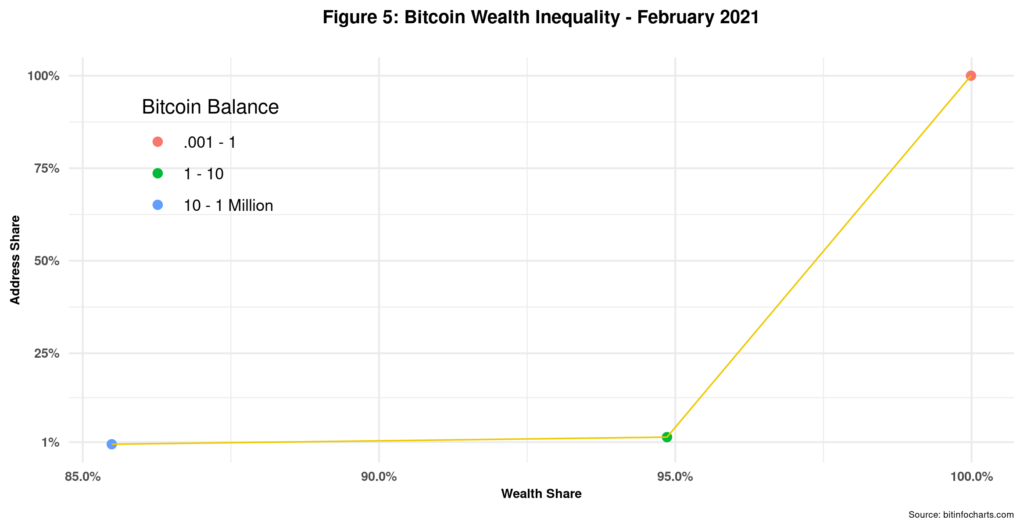
The UC, representing only 0.43% of the total population, controls 85.4% of all Bitcoin wealth. And the LC, comprising 97.7% of the total addresses/wallets, holds 5.1% of all Bitcoin wealth. The MC, in turn, is totally squeezed in between and is almost irrelevant. Is this social structure sustainable? Indeed, as Bitcoin’s LC population does make a living in the real world and can thus afford to be part of the LC, more so if Bitcoin’s price continues to go up. It will not reach the sky, though. The bubble will burst before that, or institutional investors will take full control.
Cheers, Raúl

Comments
3 responses to “Bitcoin Inequality Revisited”