In a previous blog, I examined the relationship between GDP and the Human Development Index (HDI), which the UN Development Programme (UNDP) has published annually for the last 25 years. In this post, I want to dive deeper into the latter and explore some of its potential policy implications.
HDI components and calculation
The HDI has three main elements or subindexes: Income, health, and education (or knowledge). Statistical indicators used to estimate the first two components are Gross National Income per capita (GNI) and life expectancy. The education subindex comprises two indicators: literacy and quality of education. Thus, one can think of the HDI as a 3D index where each subindexes constitutes one of its three orthogonal axes. And the HDI is the point in that 3D space where the various components intersect.
A detailed account on how the HDI is computed can be found here. 1 Note that the HDI is calculated using the unweighted geometric mean of its three main subindexes.(This is an important consideration, as changes in any of the subindexes will not necessarily have a direct linear impact on the HDI. In fact, the overall impact will also depend on how the other subindexes are performing. This can be positive as it implicitly acknowledges that the three main components are correlated. Before 2010, the HDI was calculated using the arithmetic mean. The Human Development Report Office has also identified four levels of human development, ranging from very high to low. The criteria used to group countries in this fashion have also changed over the years. Nowadays, the criteria used are based on specific HDI levels. For example, any country with an HDI over 0.8 is considered part of the very high-level cluster of countries. 2 While there is some debate on how country clustering is defined, this does not affect the argument I will make in this post.
2015 HDI
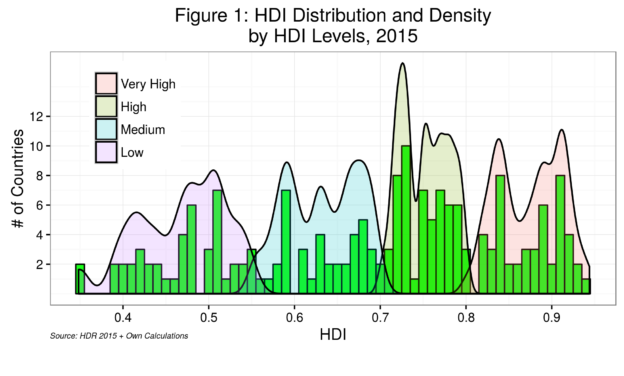
Figure 1 depicts the distribution and density of HDI scores by levels for 2015. The distribution of HDI scores does not follow the usual bell-shaped or so-called normal distribution. Rather, we see cluster distributions with at least two peaks. Most countries are on the medium and high end of HDI scores. The median HDI score is 0.7241, which sort of reflects this tendency.
Figure 2 presents the HDI and its three subindexes by HDI rank for each of the 188 countries in the 2015 Human Development Repor t. Here, it is possible to detect two distinct patterns. On the one hand, the health subindex for most countries is higher than the actual HDI score, with the average gap between the two increasing as HDI rankings decrease. This seems to be counterintuitive as we will see below. On the other hand, the education subindex presents the opposite pattern: it is consistently below HDI scores for most countries and, as expected, the average gap between HDI and the education subindex increases as rankings decrease.
“Healthier” HDIs
The health subindex pattern is perhaps best depicted in Figure 3.  Here, I computed the health subindex to HDI ratio. We can see that only 14 countries have a health subindex less than the HDI (one being the USA!), almost evenly distributed along all HDI levels. 3 It seems clear that some of the countries with low HDI levels and low health subindexes have been impacted by the spread of HIV/AIDS. On the other hand, four countries at the lowest HDI levels (Ethiopia, Eritrea, Niger, and Senegal) report health subindexes that are at least 50% larger than HDI scores. We can again see that health subindexes increase as HDI rankings decrease, noting the few outliers on the lower right quadrant of the graph.
Figure 4 depicts this trend in the health subindex but now aggregated by HDI levels. Here, I computed the average score for each 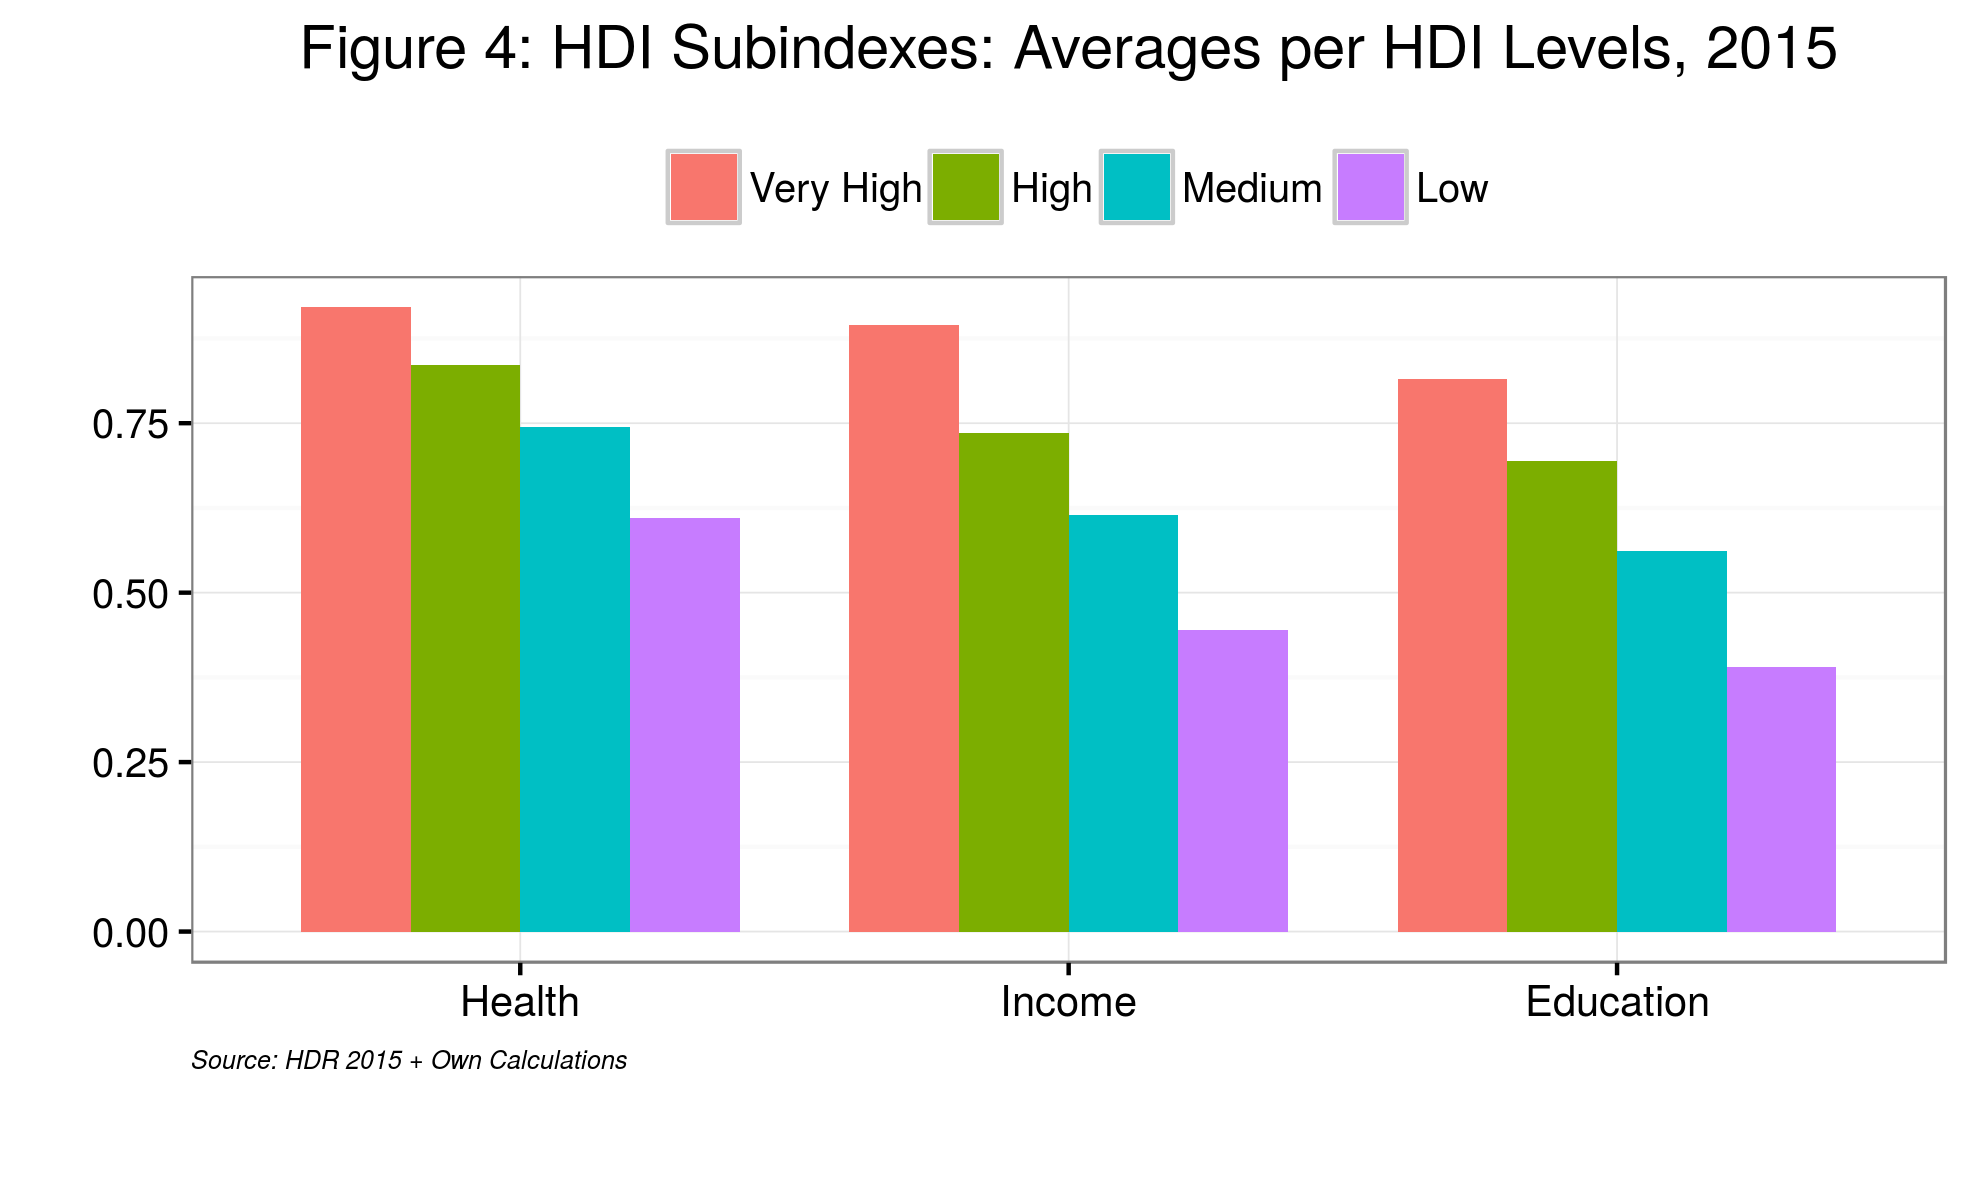 of the three subindexes by level of HDI, from very high to low. While in all cases, the three components of the HDI decrease as we move from very high to low levels of HDI, the health subindex has the lowest rate of change across HDI levels. In other words, the spread of the health subindex across countries is significantly less than that of the other two subindexes. 4 In effect, while the health subindex for the lowest HDI level is 33% less than the highest one, the income and education subindexes are 50 and 52% less, respectively.
Part of the reason for this stems from the way the health subindex is calculated. As it stands today, the standard deviation for this subindex – the average distance between any country data point and the mean of all data points – is roughly 30% lower than that for the income subindex, for example. To obtain a health subindex with a standard deviation similar to that of the other two subindexes, we need to change the minimum baseline for life expectancy from 20 to 38 years. 5 In 2015, the lowest value for actual life expectancy was 44 years. On the other hand, it is possible to argue that countries have made the most progress regarding health; consequently, this should be acknowledged in the HDI calculations.
Some policy implications
In this light, policymakers examining the three core components of the HDI might be tempted to prioritize both the income and education components. Let us not forget, however, that, unlike income, the health and education subindexes are slow-moving and can only experience significant change in the medium to long run. Short-term policy changes will thus not affect the HDI.
Still, policymakers who consider the long run might prioritize income—and education-related policies and programmes. As mentioned before, changes in the HDI are not dependent on one single subindex but rather on the interaction between its three core components, which are highly correlated.
Cheers, Raúl

Endnotes
| ⇧1 | Note that the HDI is calculated using the unweighted geometric mean of its three main subindexes.(This is an important consideration, as changes in any of the subindexes will not necessarily have a direct linear impact on the HDI. In fact, the overall impact will also depend on how the other subindexes are performing. This can be positive as it implicitly acknowledges that the three main components are correlated. Before 2010, the HDI was calculated using the arithmetic mean. |
|---|---|
| ⇧2 | While there is some debate on how country clustering is defined, this does not affect the argument I will make in this post. |
| ⇧3 | It seems clear that some of the countries with low HDI levels and low health subindexes have been impacted by the spread of HIV/AIDS. |
| ⇧4 | In effect, while the health subindex for the lowest HDI level is 33% less than the highest one, the income and education subindexes are 50 and 52% less, respectively. |
| ⇧5 | In 2015, the lowest value for actual life expectancy was 44 years. |