Most reports presenting indices of any kind include a section or annex detailing its methodology and furnishing basic equations to replicate index calculations. Unfortunately, GIRAI does not follow such a pattern. The report has scant information on the topic. The website explains a bit more but falls short, too. However, the latter links to a Google spreadsheet containing a data dictionary and detailed scores for each of the 19 thematic areas per country (19 x 138 rows), in addition to the scores and rankings found in the report. The dictionary provides beneficial information, summarized below in equations [A]—[G].
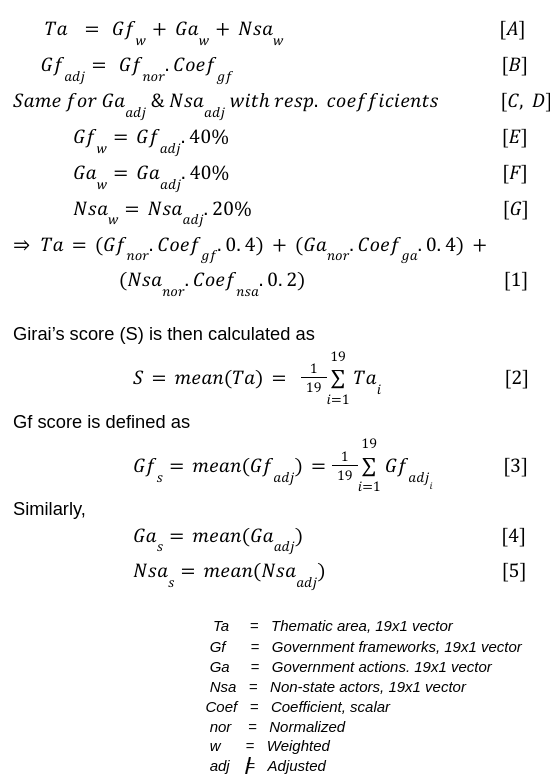
Each country has three types of scores for each of the three core pillars. For example, the government framework pillar (Gf) has normalized, adjusted and weighted scores for each thematic area (Ta). Equation [1] shows that we can compute Ta using the normalized score for each pillar multiplied by its respective coefficient and assigned weight. It thus relies heavily on the size of both. Equations [2]—[5] show how the overall GIRAI score (S) and scores for each of the three pillars are computed. The former can also be calculated by adding the means of each of the three pillars’ weighted scores, as evidenced by equation [A]. Pillar score estimations depend on the adjusted scores (pillar normalized score times its respective coefficient, equations [B]—[D]) but do not use assigned weights.
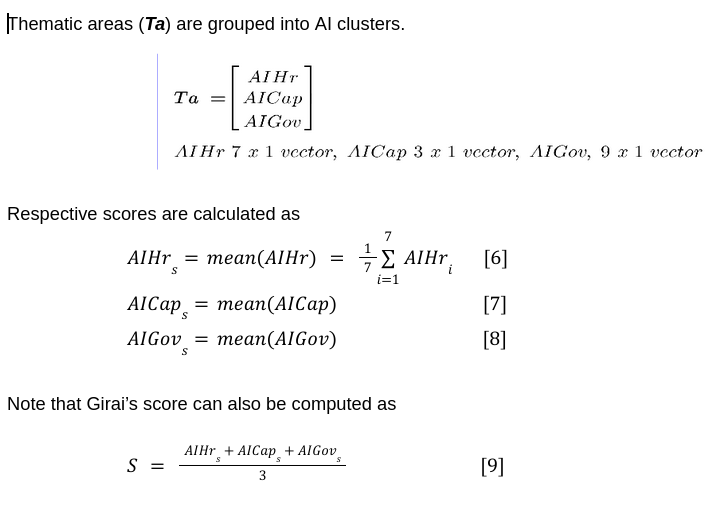
Below are the relevant definitions and equations used to compute the scores for the AI human rights, capacity, and governance clusters or dimensions, which are vectors smaller than Ta. Note that we can calculate the overall S index score in three ways, as shown in equation [9] — in addition to [A] and [1].
The above should suffice to please researchers trying to replicate index calculations quickly. I have a script with a few code lines that take me there expeditiously. Regardless, I am still pondering on the reliance of the various indices on weights and coefficients, as neatly shown in equations [A]—[G] and [1]. I have not found any explanation of how the weights were assigned to each pillar. Gf and Ga have the same weight and account for 80 percent of the total. Maybe we are expecting too much from governments, which, in the case of the South of the Global South, have little capacity (human, fiscal, and infrastructural) to do much alone. Again, while using weights might be cool, the report or website should explain their rationale. Why do we need weights?
The word coefficient(s) is mentioned three times in the report, thus beating the GIRAI methodology website page by two. The report says: “These coefficients were derived from global series from the World Bank and Freedom House, measuring Rule of Law, Regulatory Quality, Government Effectiveness, Control of Corruption, Freedom of Expression & Belief and Associational & Organizational Rights. The purpose was to contextualize the findings of the GIRAI primary data collection and provide a more precise reflection of the effectiveness of the evidence assessed for each pillar at national level.” (pg. 10). I am unsure if these cover all 19 thematic areas systematically, as some fall outside the scope described in the above quote, while others might only be partially covered. That can be problematic as each of the three pillar coefficients, all scalars and not 19×1 vectors, are applied to all thematic areas, regardless of clusters or dimensions. Clues on how these coefficients were calculated are not available. We know they oscillate between 0 and 1, so a normalization process must have occurred here too. They also vary widely across countries, as shown below.
In any event, I cannot replicate them, no matter how many code lines I add to my programming script. However, we can indeed examine them more closely statistically. The figure below showcases the histograms for each of the pillar coefficients.
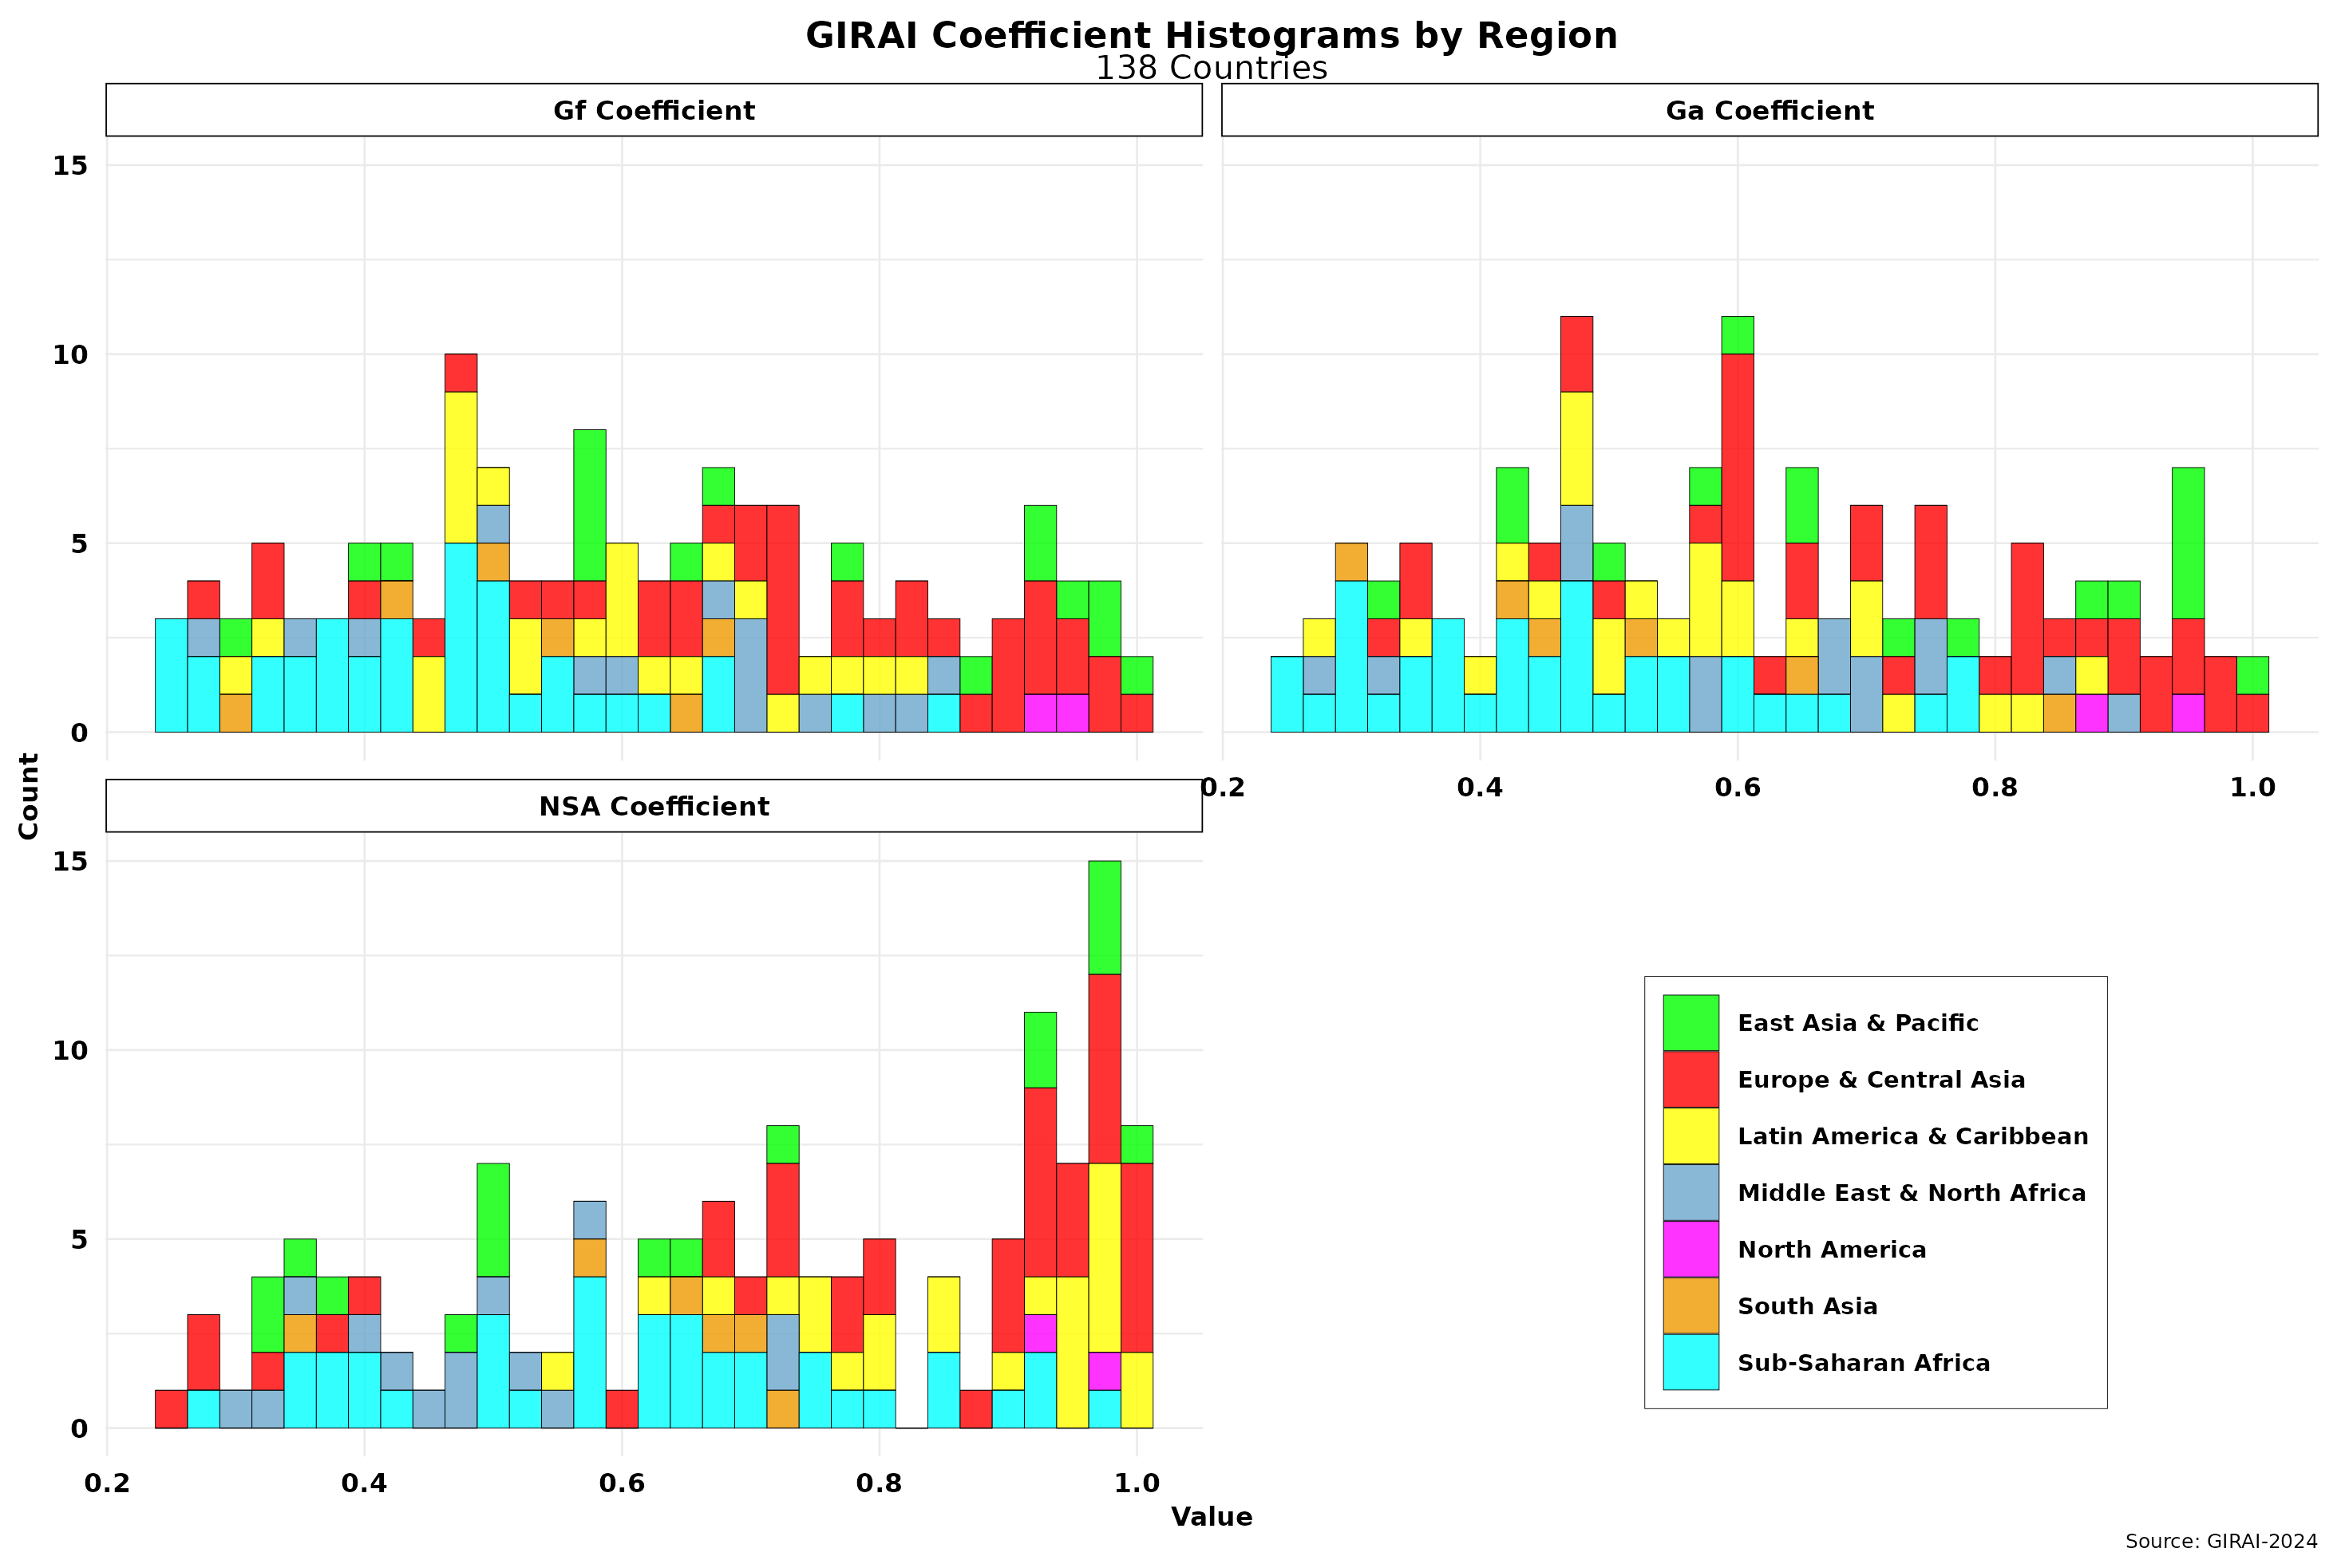
While the Ga and Gf coefficients seem to follow a normal distribution, the NSA one is skewed to the right. Indeed, scores here are much higher than the other two in six of the seven regions covered by the index. The NSA coefficient has the largest standard deviation. Comparing it with the histogram for GIRAI’s score (S) I shared in the previous post, which is characterized by a power law distribution, we can intuitively conclude that the NSA coefficient could have the most significant impact on score sizes and distribution. This trend is ameliorated by its relatively smaller weight (20 percent) than the other two coefficients.
We can uncover the issue using regression analysis. We obtained the results below by regressing the Ta (ta_score, 19 thematic areas for 138 countries) against pillar coefficients.
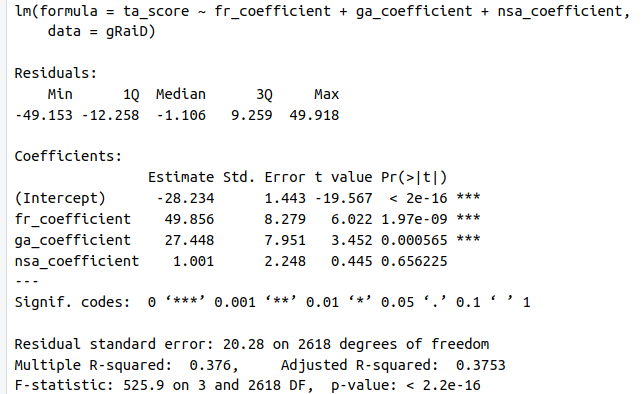
While parameters for both Gf (fr in the regression equation) and Ga are highly significant, the NSA coefficient is hanging loose. That strongly suggests it is introducing bias in the estimations. Note also that the Gf regression coefficient is the largest and thus the one with more explanatory power regarding score results. In other words, changes in the Gf coefficient will generate more considerable changes in score estimates than those triggered by Ga, while changes in NSA might add more noise. That might also indicate that the 40—40 percent weight split between Gf and Ga might not be ideal. In any case, the behavior of the NSA coefficient should be explored in more detail.
The figure below shows the same issue from another viewpoint. It compares country NSA scores (equation [5]) with country GIRAI score rankings by income level.
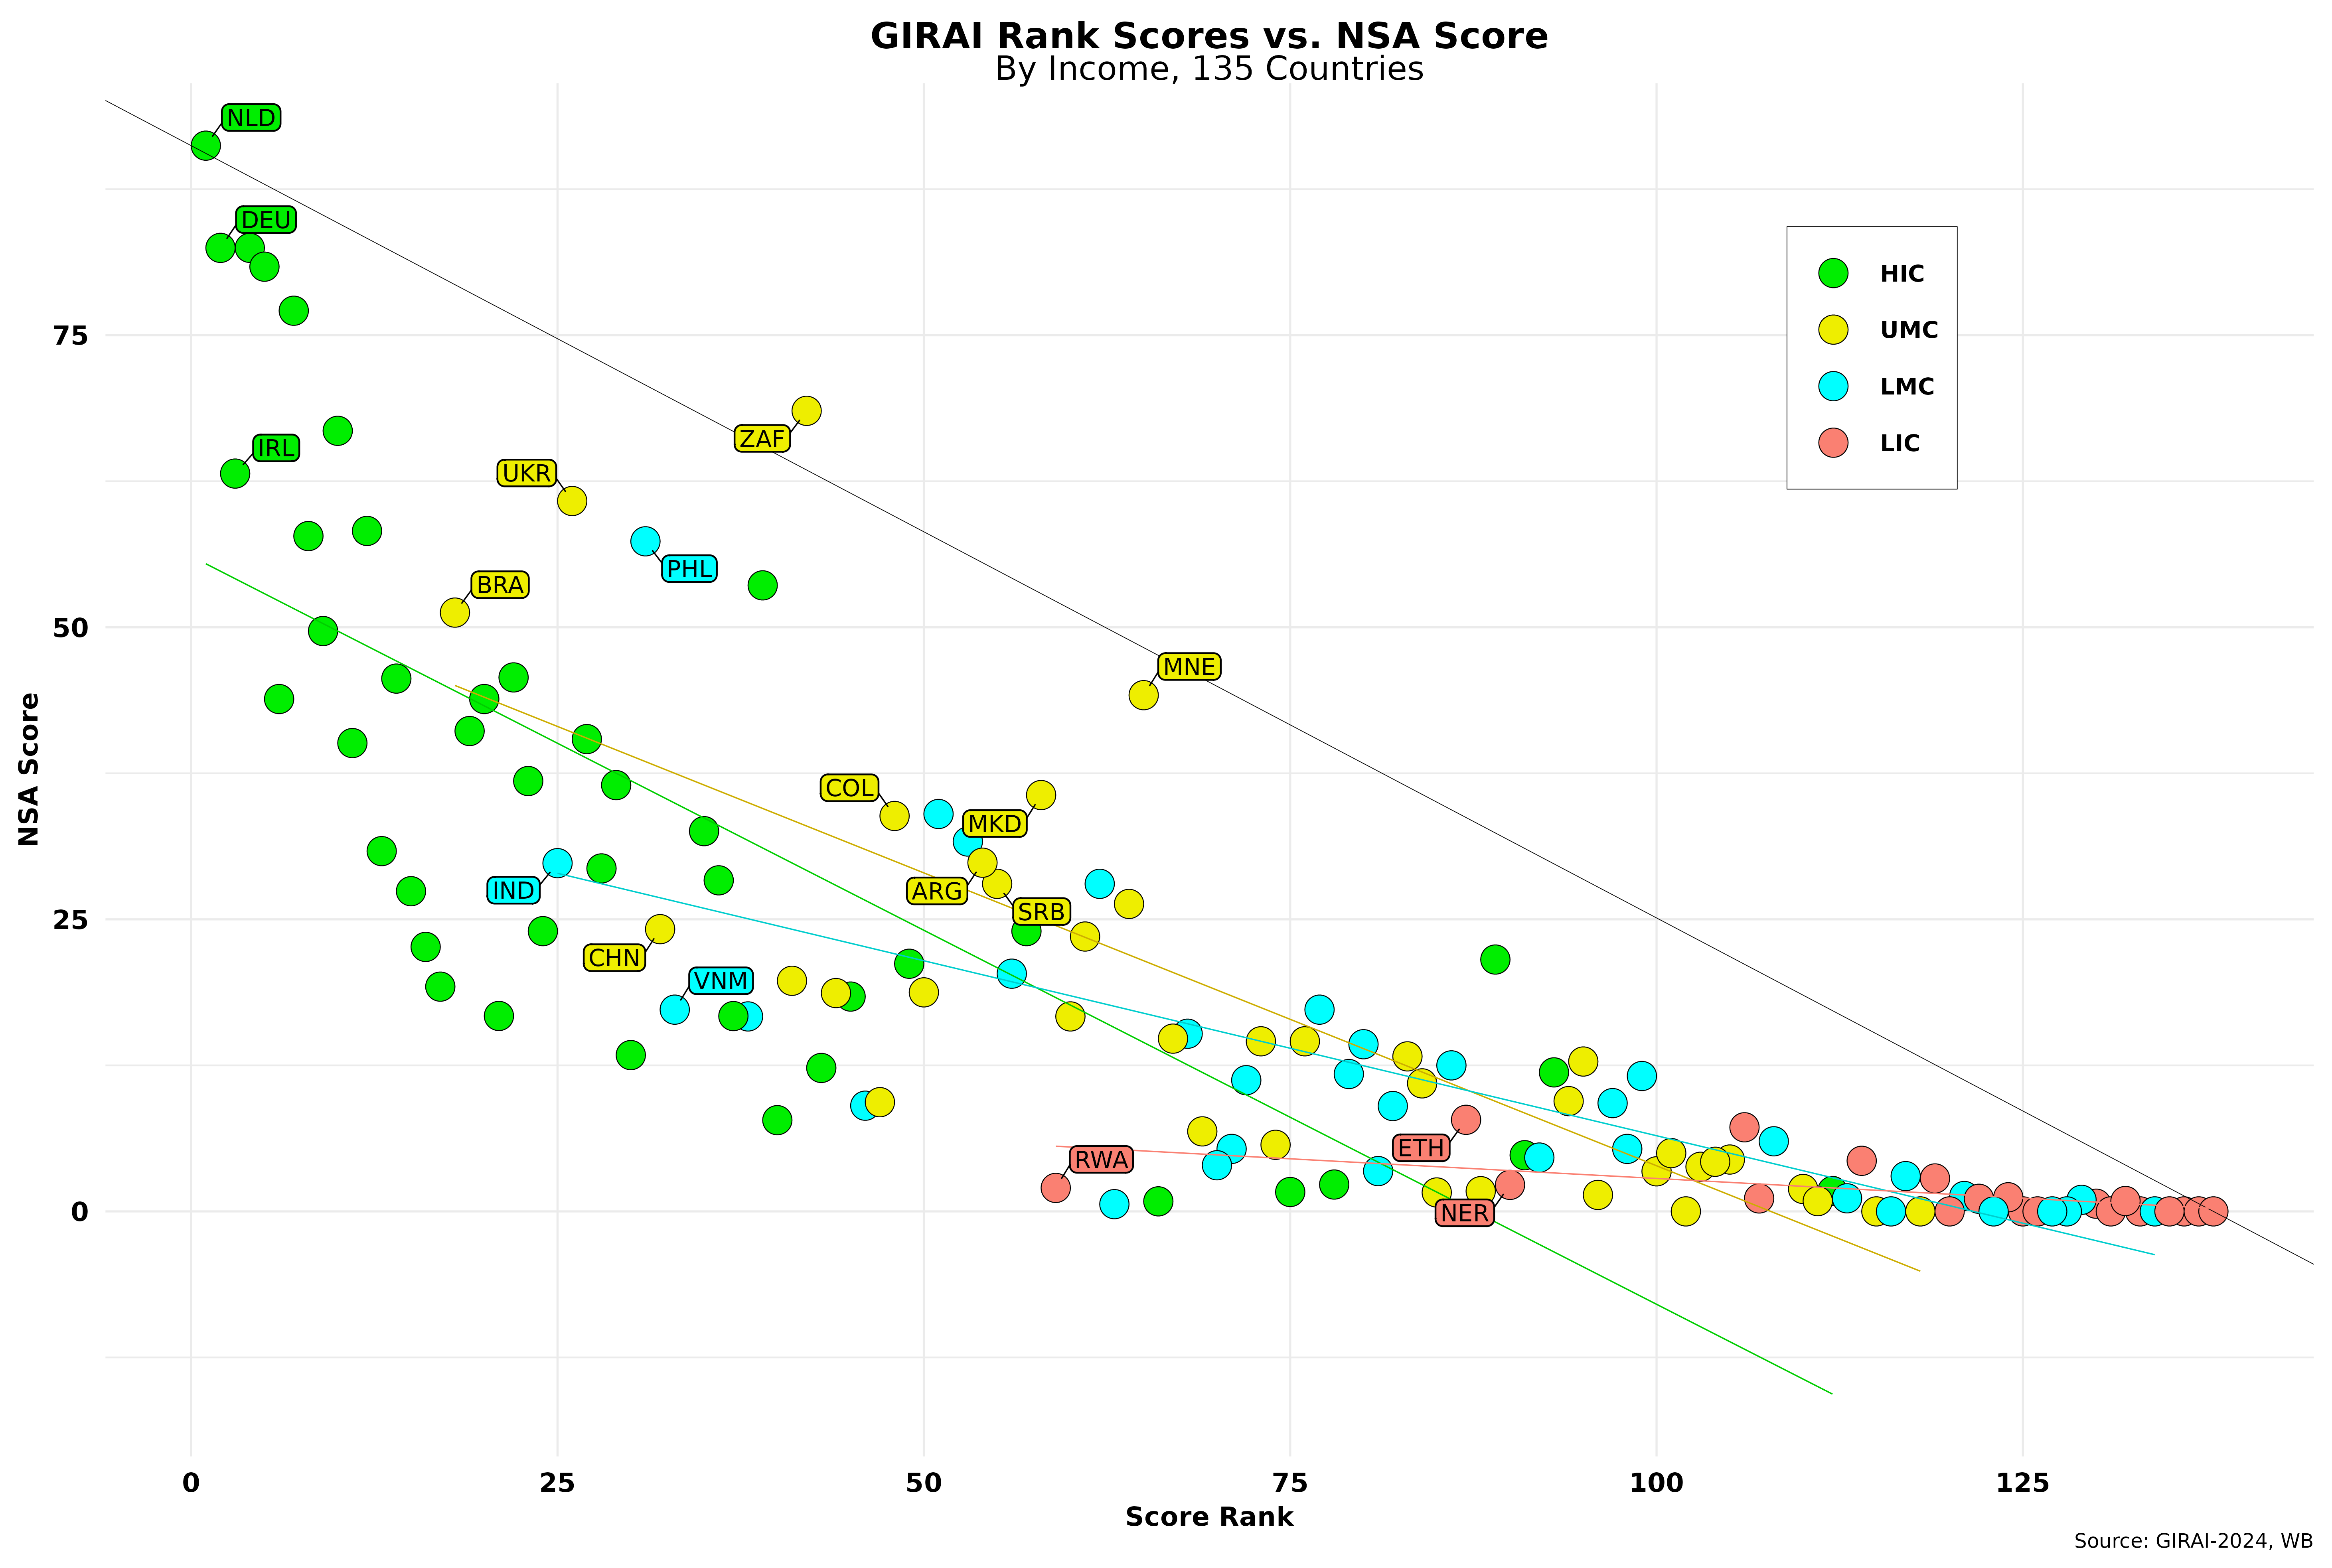
The thin black line links the maximum NSA score to the maximum rank number (135, as two countries have no official WB income level assigned and a third in a territory). NSA scores should be close to such a line in an ideal world. I have drawn a simple regression line for each income level. It does well for LICs, given the prevailing low scores in that rubric, but shows significant residual errors for all others. For each income, the top three ranked countries have been labeled. A bunch of UMCs are very close to the thin black line, so I have labeled a few. South Africa (ZAF) is doing exceptionally well here and has the sixth-highest NSA score among all countries, followed by Ukraine, which is 9th in the overall NSA score rankings.
To explore the impact of the assigned weights for the adjusted pillar coefficients (equations [E]—[G]), we can compute the overall index scores without any weights or use different weights altogether. In the former case, we can multiply the adjusted pillar coefficients by 1/3 so they range between 0 and 100 to comply with index requirements. Equations [3]—[5] show that weight changes do not impact final scores for each pillar. However, the total dimensions scores (AIHr, etc.) are not immune to weight changes.
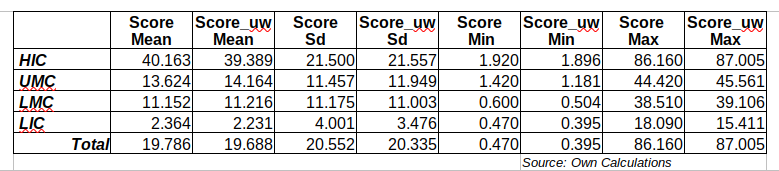
The table below shows core statistics for the weighted GIRAI score (S) and the unweighted (_uw) I have calculated. No significant differences can be detected at the macro level (row Total) or by income level, suggesting that weights are not making a massive difference. The fact that many countries’ thematic areas have zero scores (I will show this in the next post) partly explains this. Widespread data absence reduces the stochastic nature of the “AI ecosystem.”
Using weights and coefficients to develop and estimate indices is not a best practice. Doing so introduces a series of well-known issues that must be carefully considered before making such a decision. They include bias, subjectivity, manipulation risk, conceptual and computational complexity, reality distortion, reduced explainability, sensitivity to change, difficulty in comparing with other indices, and degree of transparency. However, that does not mean we should avoid them at all costs. When doing so, researchers should explicitly address most, if not all, of these issues and share them publicly.
In the next post, I will examine the index numbers and rankings.
Raul
