Talk about an ongoing AI bubble seems to be getting louder by the minute. As previously mentioned, estimates indicate that by 2030, close to 7 trillion USD will be invested in the sector—assuming the bubble will not burst in the interim. Most of this massive investment is expected to go toward digital infrastructure, led by chips and data centers. Prospective investors are not limited to hyperscalers. Private equity firms and sovereign wealth funds are also expected to join the game. In fact, equity firms have already moved forward by acquiring large data center firms. At any rate, the expectation here is that hyperscalers’ share of the global data center capacity will increase to 60 percent, according to some estimates. That could certainly hurt long-tail small cloud providers in the short term.
That said, new investments are expected to go to the most profitable cloud markets. So where are these wonderful places? The figure below provides part of the answer (click to enlarge).
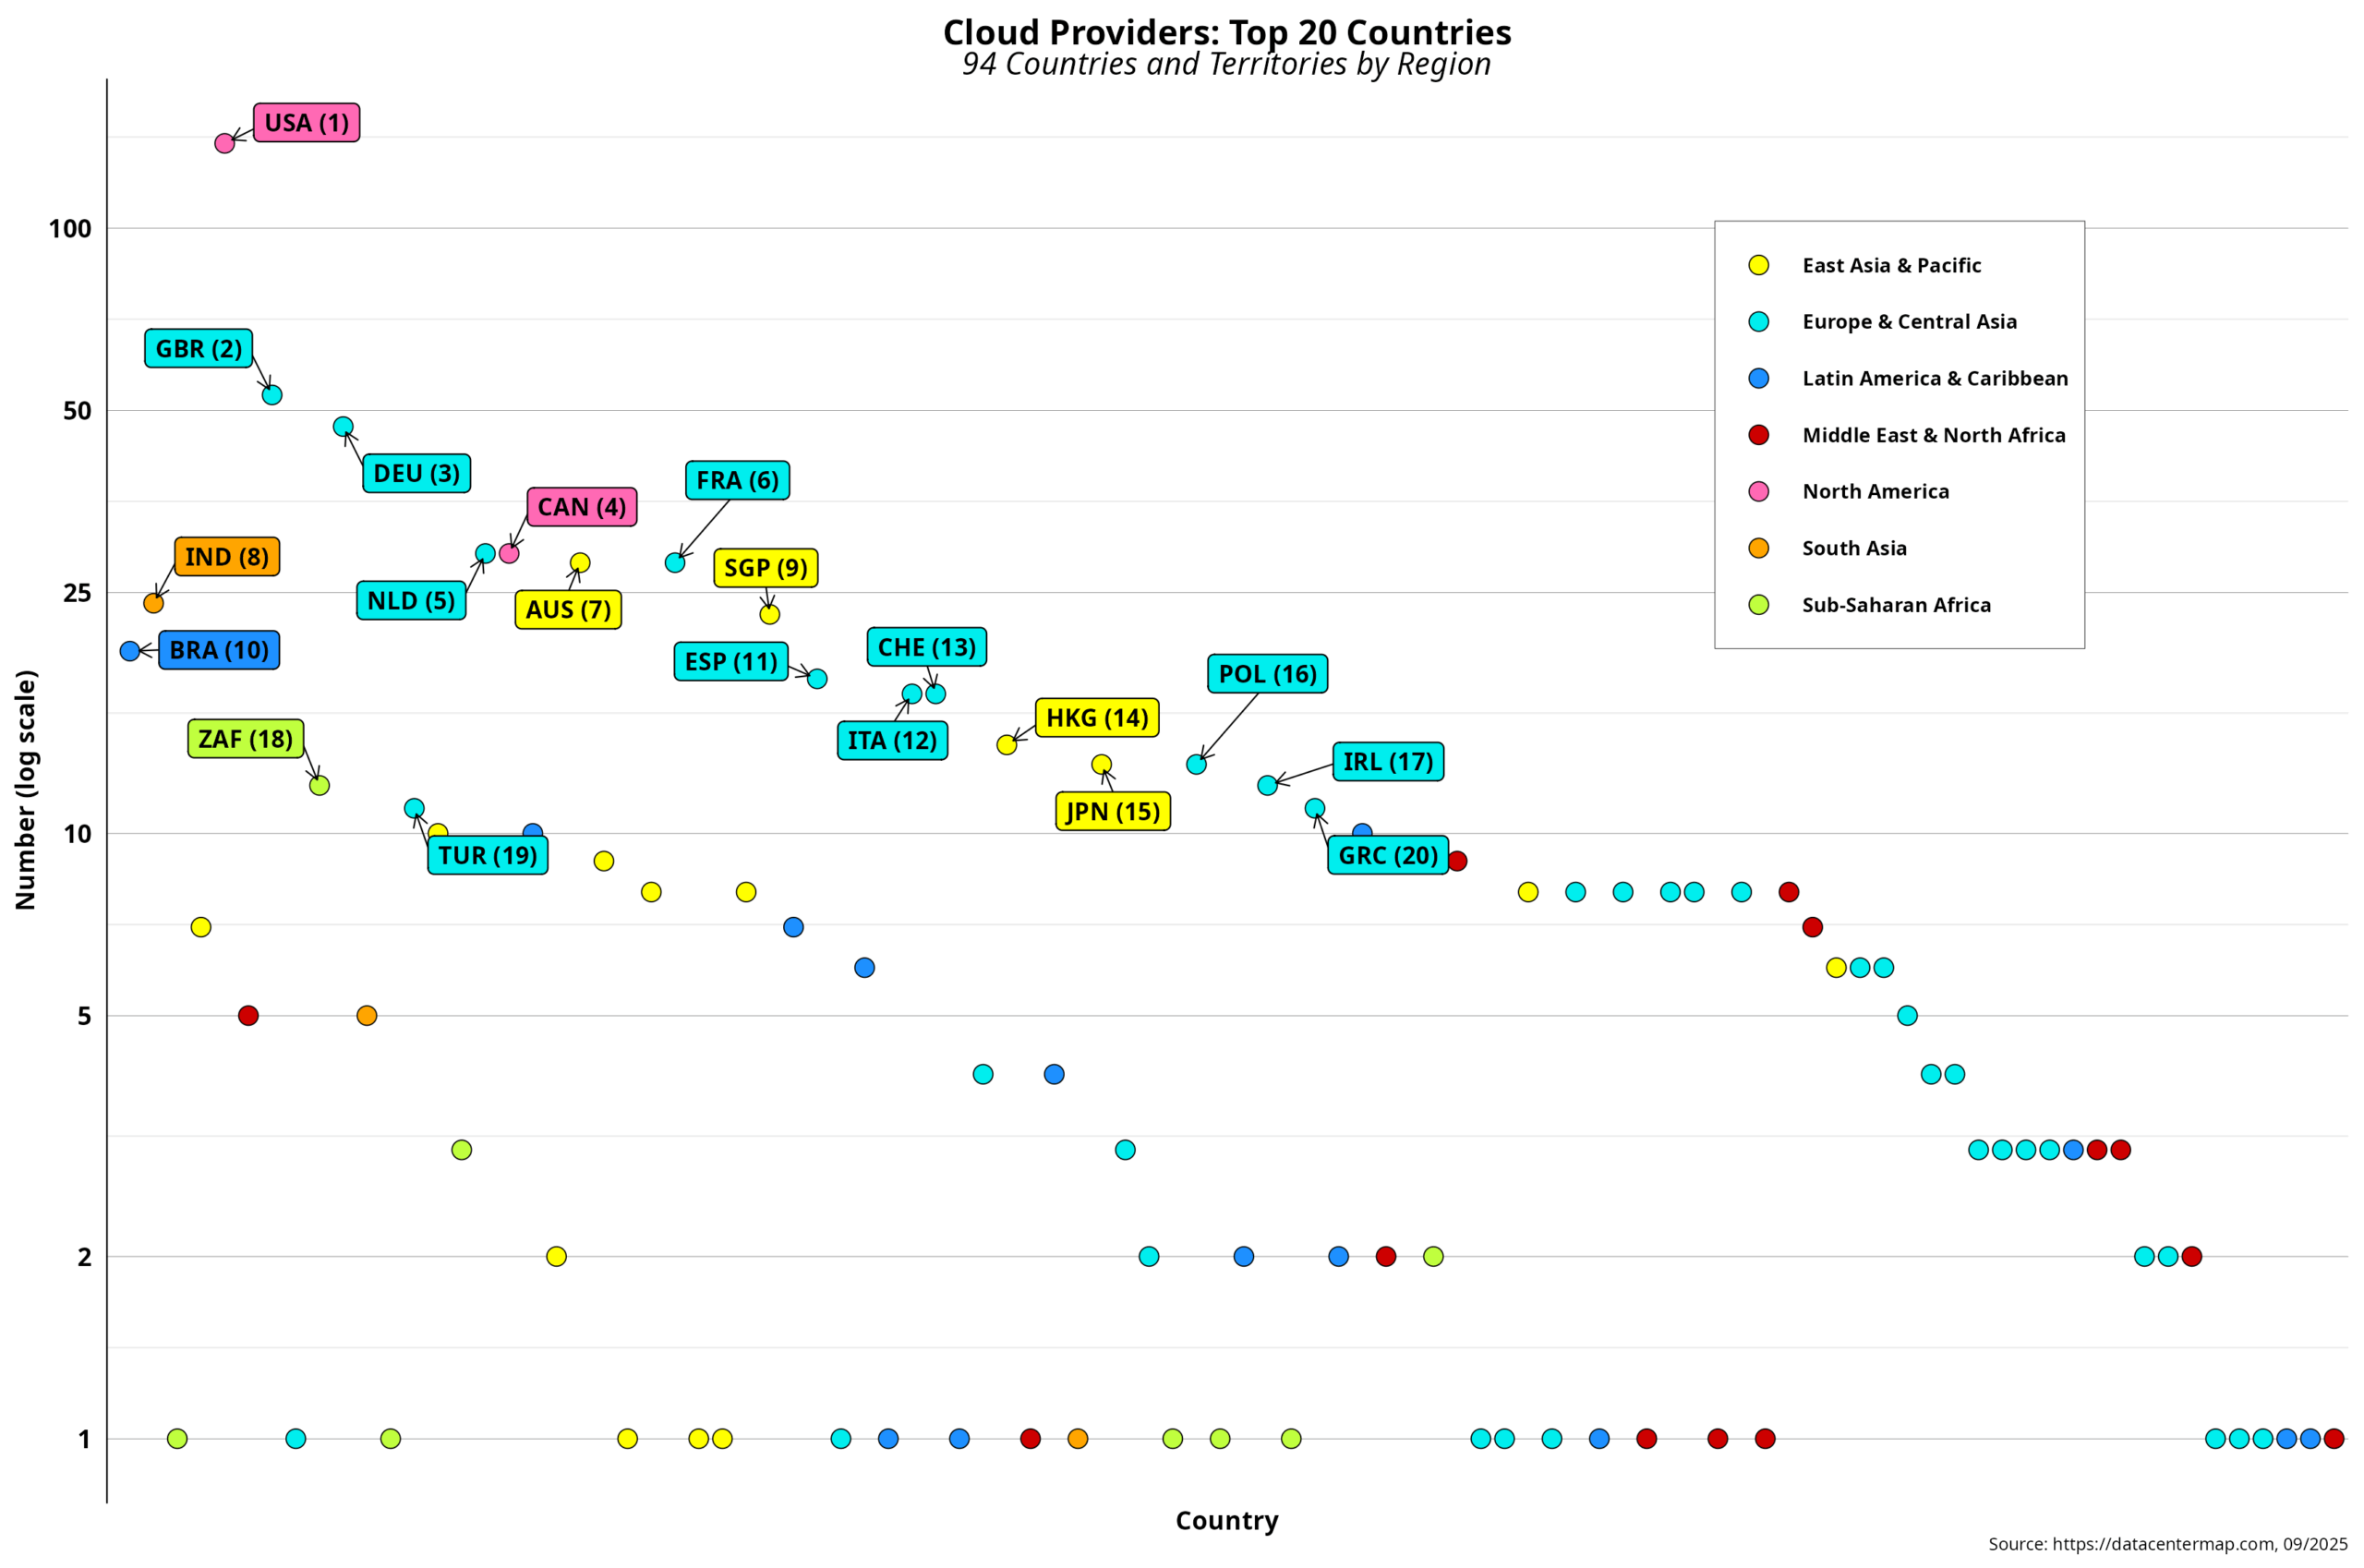
The top 20 countries are highlighted, with each label showing global ranking. As with data centers, the U.S. is well ahead of the rest, but by a much smaller margin than in the former case. Recall that the data is limited to unique cloud providers per country, not the total number of providers. The top 20 are mostly the same as those for data centers, with one notable exception. China has vanished from the top echelons. DCD data shows that China has only eight unique providers and is therefore way down the rankings.
On the other hand, South Africa joins the leaders as the only representative from sub-Saharan Africa. Europe and Central Asia have the most countries in the top 20, with 11. From the graph, we can also see that the other 74 countries and territories have 10 or fewer cloud providers. In fact, 27 countries have only one, while 49 have fewer than five. As expected, the global distribution of cloud providers is also fairly uneven. In this light, betting on where the cloud investment tsunami will direct its force does not require sophisticated probability analysis.
Yet we can get a more nuanced view by looking within each region, as shown in the visualization below. Again, I have not included North America, which consists of only two countries, both of which are among the top four overall. The top three countries per region are highlighted. Countries and territories lacking World Bank income classification are excluded.
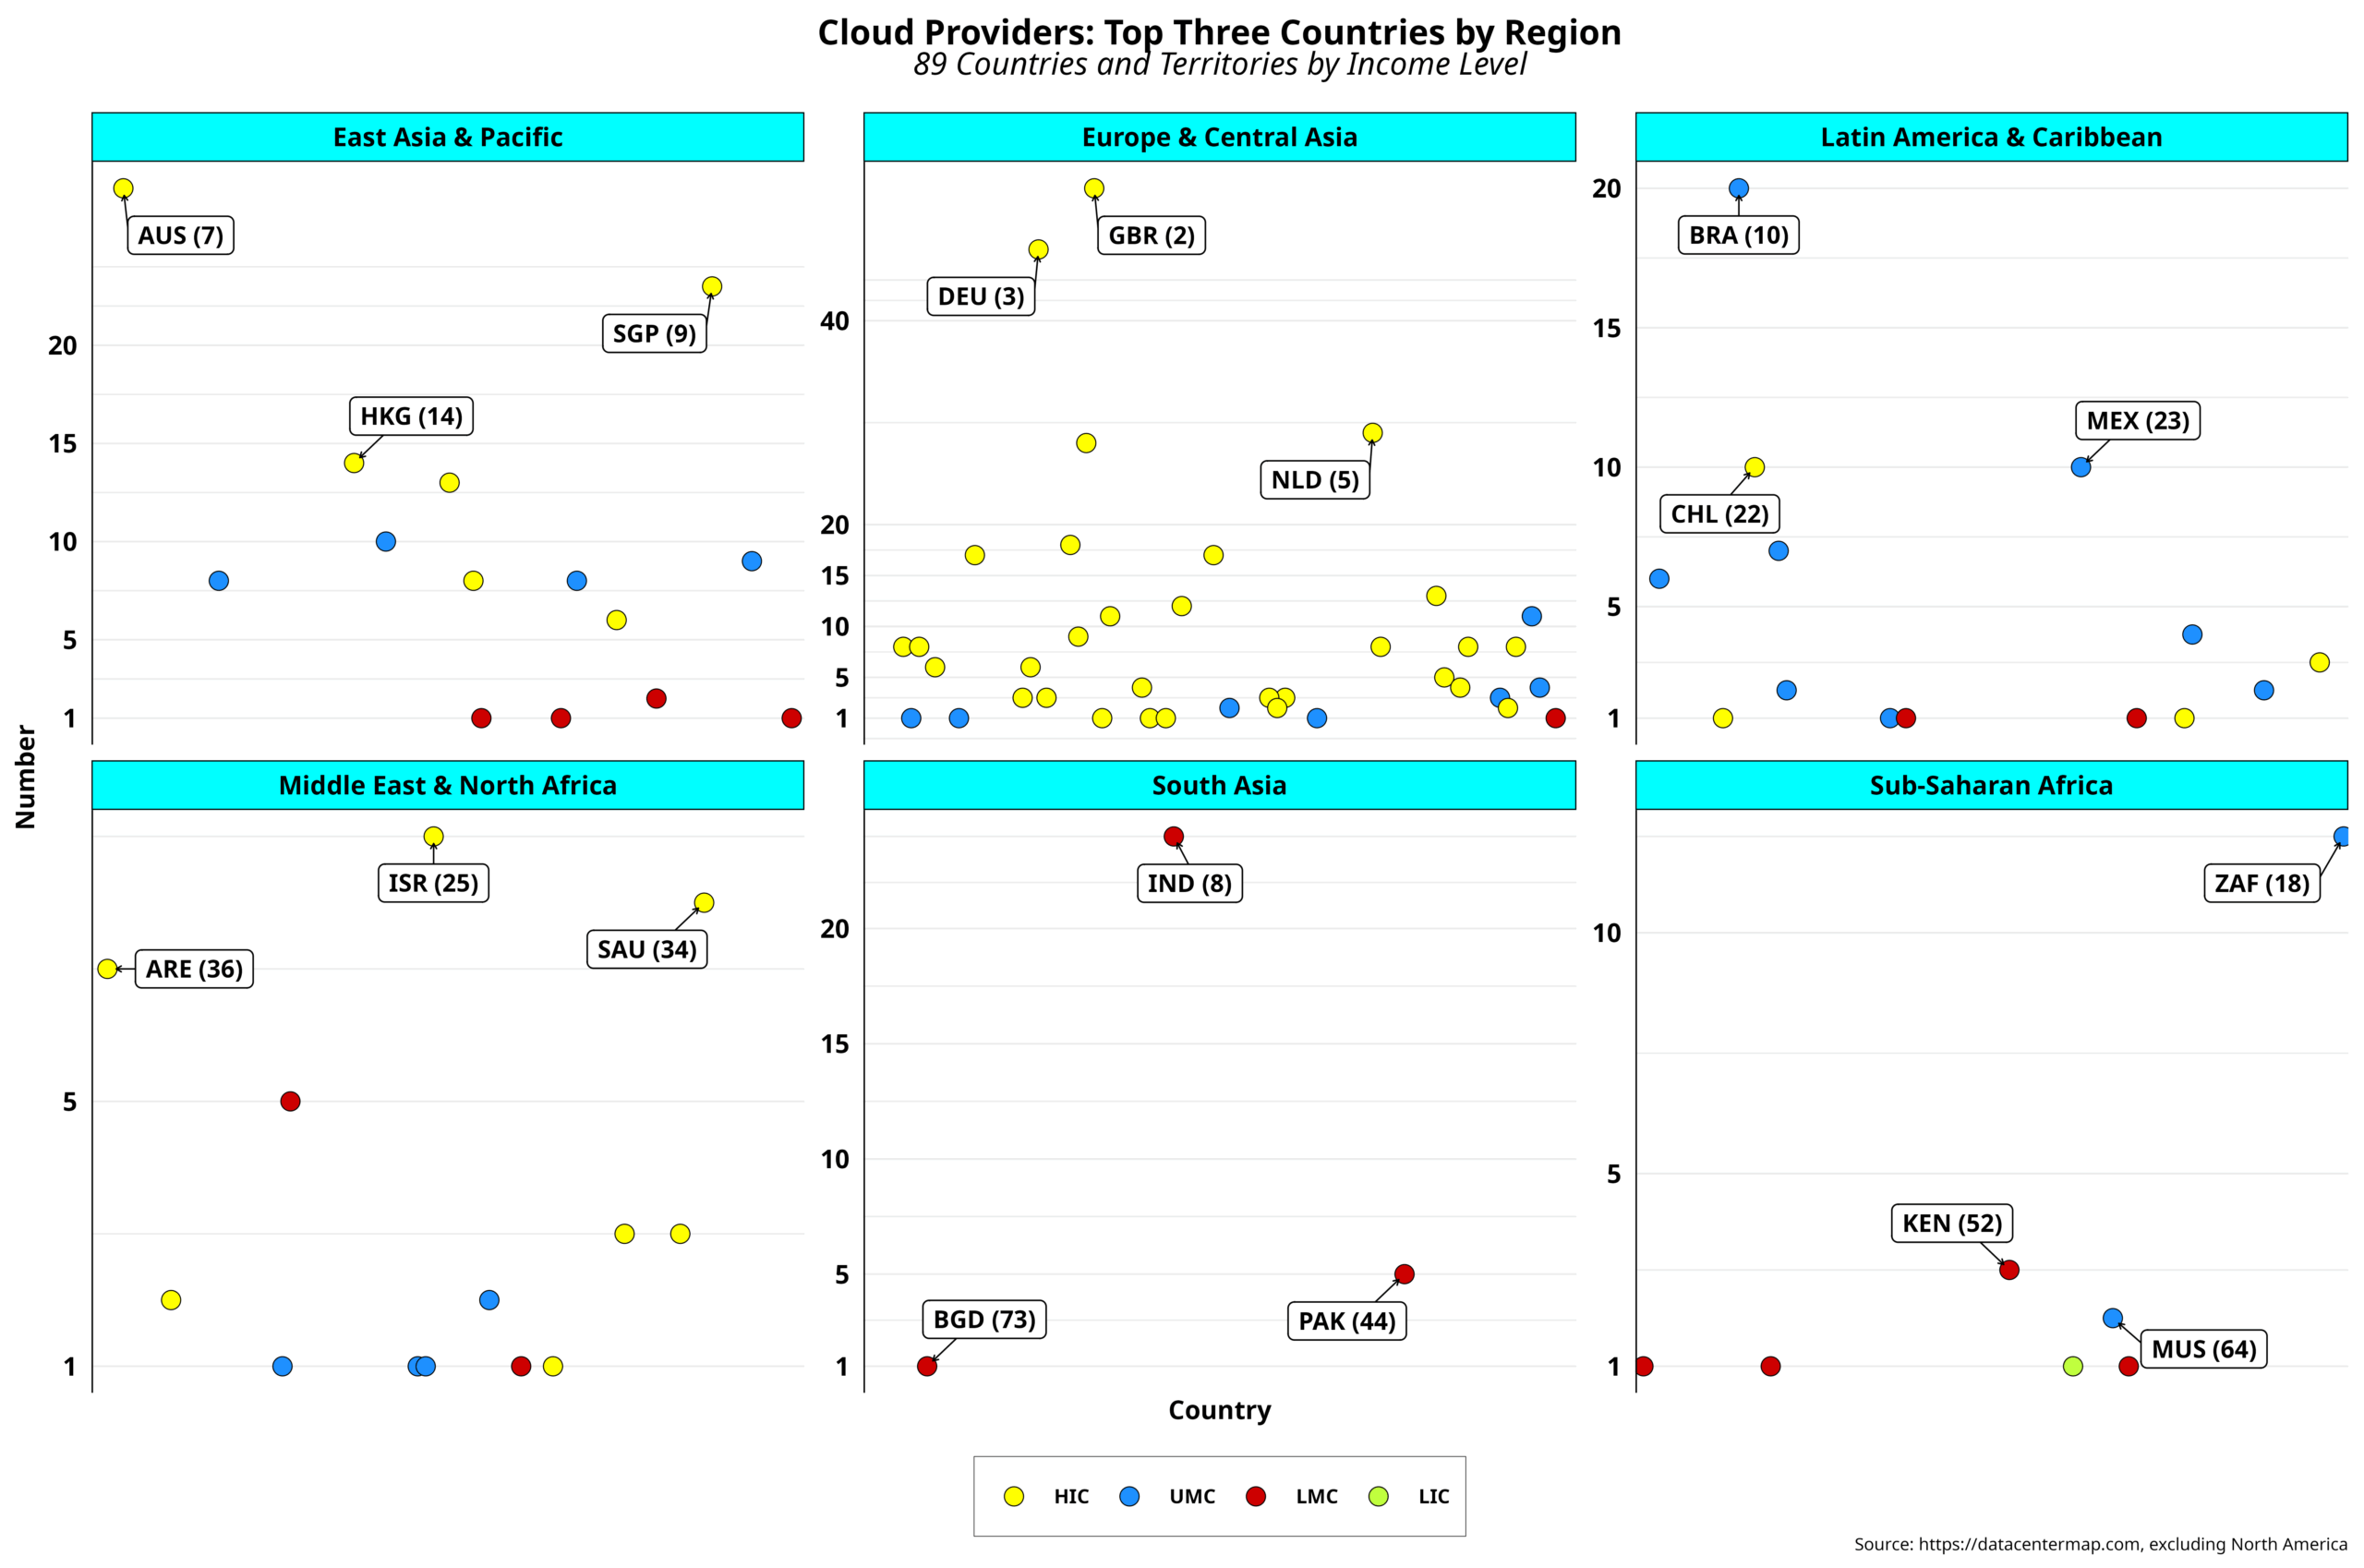
The graph is strikingly similar to that of data centers. The absence of China in East Asia & Pacific and the presence of Mauritius (with Nigeria displaced) in sub-Saharan Africa are the only notable differences. Intraregional disparities remain essentially unchanged, while the number of cloud providers in developing countries is relatively small in most cases.
I also created a graph using World Bank income levels and got results similar to those from data centers. The main difference here is that low-income countries (LICs) have only one representative in the dataset: Madagascar. The country has only one cloud provider and is ranked at the very bottom of the scale. Needless to say, in-country cloud provision largely depends on the number of Internet-connected users. Small markets are not on the radar screen of most investors, but might be attractive to local entrepreneurs.
The fact that the global distribution of cloud providers closely follows that of data centers is surely not coincidental. It reflects the close infrastructural ties between the two, which usually translate into business relations and profit maximization. However, such relationships are not always symmetrical. The massive influx of cloud investments will tilt the balance in favor of its providers. Obviously, data centers will not disappear, but they will likely change dramatically in the near future if the AI bubble survives a puncture.
Looking at cloud data by cities can enhance the view. The graph below shows the top 30 cities categorized by region.
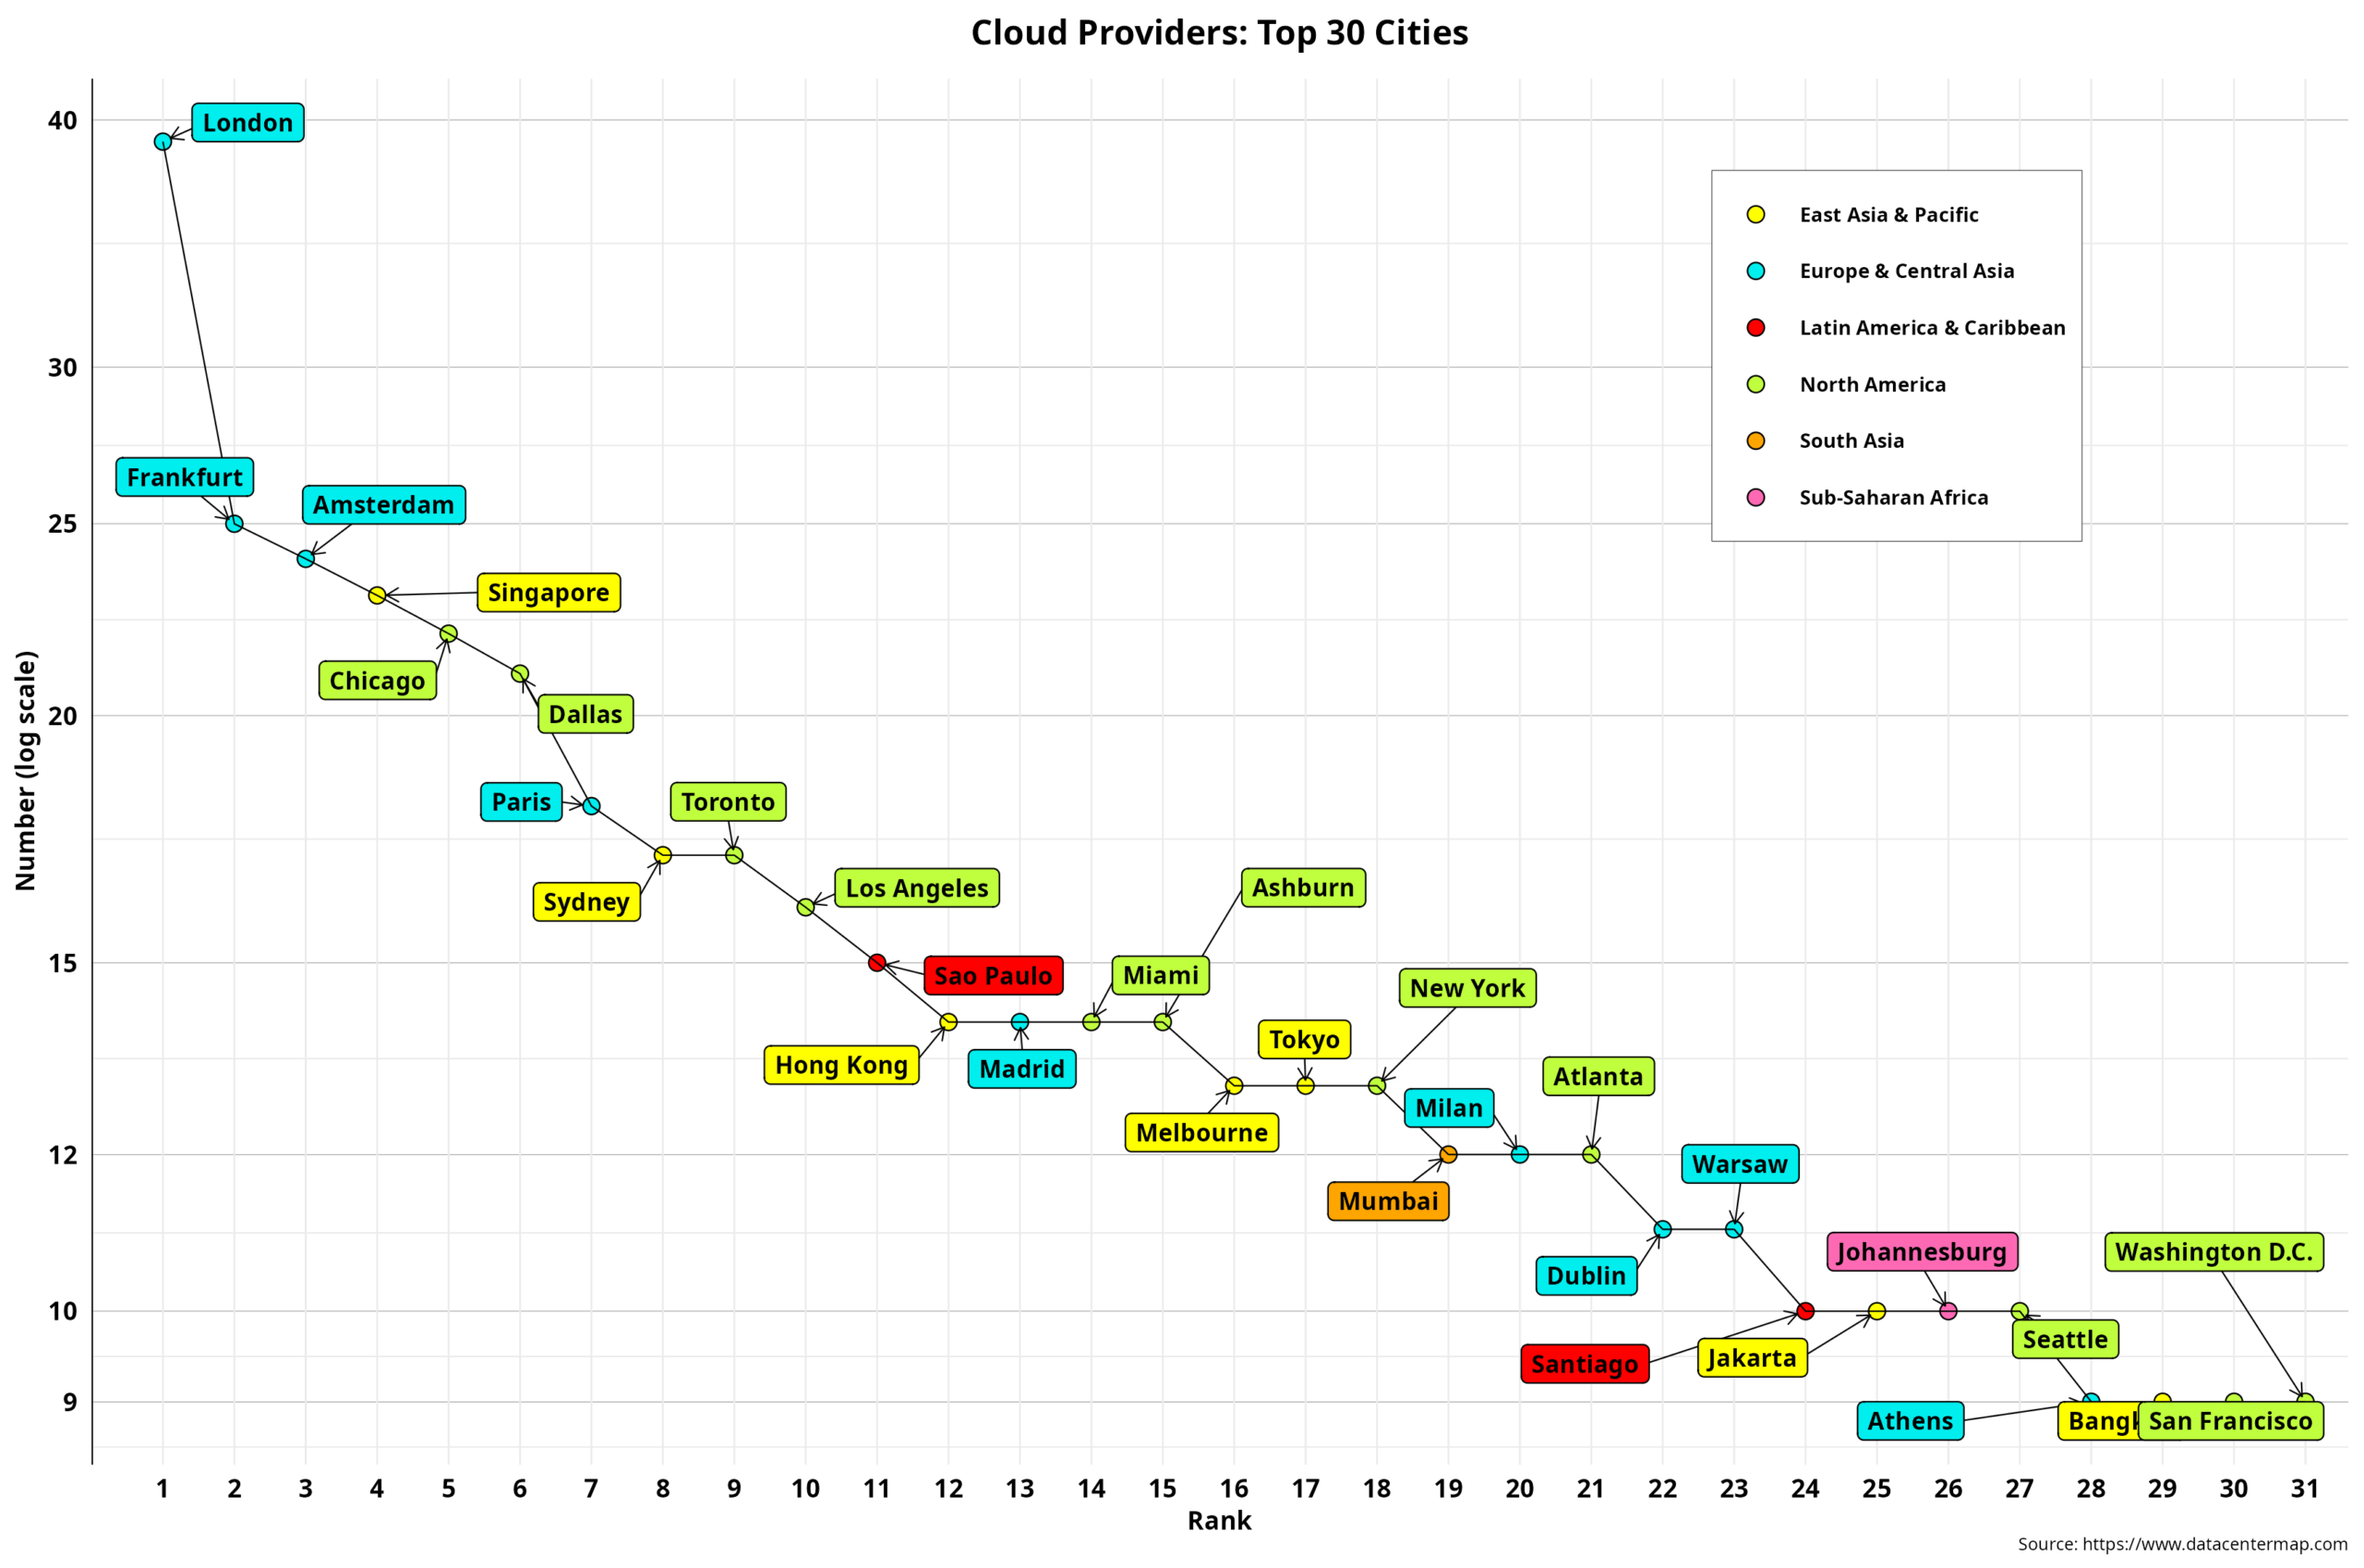 Unlike data centers, where U.S. cities dominated the top five, European cities are now running the show, with London leading globally with 39 cloud providers. Singapore is perhaps a surprise, even beating Chicago by a couple of goals. However, ten U.S. cities are among the top 30, followed by eight European cities and East Asia & Pacific with seven each. India is represented only by Mumbai, while LAC gets two spots in Brazil and Chile. Finally, Johannesburg is the lone participant from sub-Saharan Africa.
Once again, no city from MENA is part of this exclusive club. Note that seven cities from developing countries are part of the group, which once again suggests the complexities of data center and cloud infrastructure development. It is surely uneven. But, at the same time, it is not binary. Indeed, developing cities, best positioned within the global economy, can also become targets for capital investment to deploy the latest technologies, while their home countries still face daunting development challenges.
Another similar pattern we encountered when reviewing data center data related to the per-country city concentration of providers. Indeed, 14 of the top 30 cities comprise over 50 percent of all country providers. That includes all developing-country cities, except Mumbai. Recall that India’s data center distribution is relatively even across Indian cities. Cities like Amsterdam, Madrid, Tokyo and Milan are part of such a group, while the world leader, London, is just below 50 percent of the UK’s provider totals. Others, like Frankfurt, Paris and Toronto, hover around 40 percent. This is evidence of ongoing cloud provider clustering.
Finally, we can look at additional geographical and economic statistics for the top cloud providers, as well as a few I randomly selected from developing countries. The data is summarized in the table below.
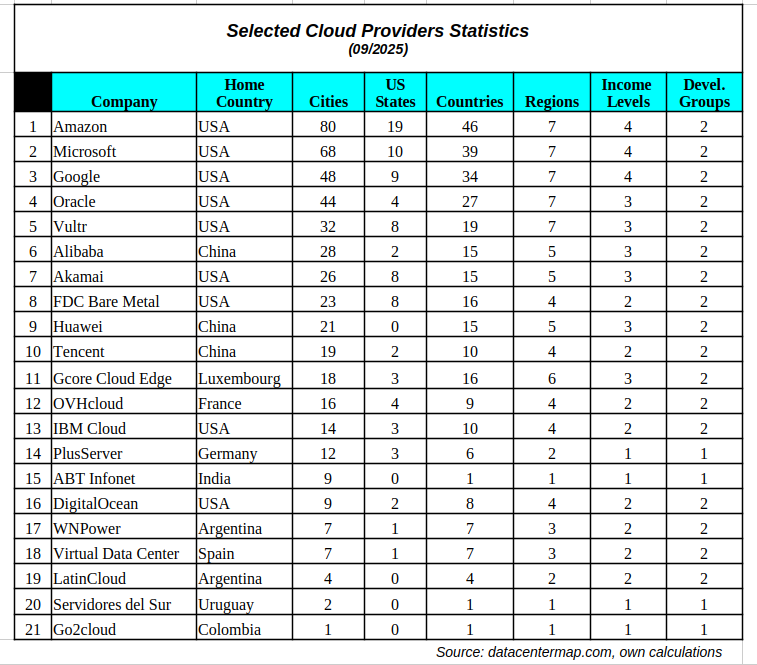
Let us use Amazon as an example of how to read the table. The U.S. company operates in 80 cities or markets, 19 U.S. states, 46 countries, all seven regions we have covered before, all four income levels defined by the World Bank, and in both developed and developing economies. Amazon also leads in all categories. So the next time we read that it has a 30 percent market share, we can get a better grip on exactly where that might be happening globally. And yet, the company covers only 50% of the total number of countries in the data set. That opens the door for long-tail cloud providers in those markets where the big players have no intention (yet) of bringing their wares into action.
The top ten cloud providers have only two nationalities, U.S. and China, albeit Huawei has been kicked out of the U.S. market. At the bottom of the table, we find a few developing country providers that, for the most part, operate in developing countries, except for WNPower, which has an operation in Miami. All others operate within national or regional confines and are comparatively small. Whether they will survive the current AI bubble remains to be seen and depends in part on the bubble’s lifespan.
The forecast is cloudy with a few heavy thunderstorms possible.
Raul
