Now that we have a clearer picture of the uneven distribution of data center locations, we can take a closer look at cloud providers. The first step here is to conceptually differentiate between data centers and cloud providers. Recall that the business literature states that cloud providers are one of the five types of data centers. While classic data centers essentially offer physical space, connectivity, power, and cooling to business customers, cloud providers generally sell IT-related services, much like a typical public utility, but for profit.
Needless to say, cloud providers usually run on clusters of data centers, which they sometimes call zones or campuses. They can either own them directly or lease them from traditional data center providers such as Equinix or Digital Realty, the world leaders. However, all hardware, software, applications, and connectivity are designed to support remote or virtual access and the effective use of the digital services offered by the cloudistas. These include public clouds, private clouds, hybrid clouds, and dedicated offerings such as infrastructure-as-a-service (IaaS), software-as-a-service (SaaS), platform-as-a-service (PaaS), bare-metal (dedicated server racks) access, content delivery networks (CDNs), and containers.
More recently, GPU-as-a-service supporting LLMs and machine learning services has rapidly developed, undergirded by so-called Neoclouds. In all cases, end users pay for the use of various computing and IT services and thus incur no capital expenses. The use of data center physical space, connectivity, power, and cooling is prorated by service type and user demand. Still, it is not the primary business driver, nor is it directly visible to the customer.
As mentioned before, the business literature also provides a categorization for cloud providers. First are the hyperscalers, such as Amazon, Microsoft, and Google, that run massive data center facilities and clusters, have growth rates of 20 to 30 percent, and together have a 65 percent market share. A second tier includes Alibaba, Huawei, IBM, Tencent, Oracle, and OVHCloud, among others, which have growth rates of 10-20 percent and market shares below 5 percent. Platforms such as Apple, TikTok, Salesforce, Cloudflare, and others alike have similar stats but are focused on niche markets. The final tier includes all other cloud providers, which are usually small, have low growth rates below 10 percent and together control just over 20 percent of the market.
The statistical dispersion among cloud providers thus follows a power-law distribution, with a few players controlling a large share of the market. At the same time, the rest, typically in the hundreds, have minimal market shares. Pictorially, we can visualize a steep descending curve with a very long tail that asymptotically approaches the x-axis. Such a pattern is indeed familiar. It is, yet again, the winner-takes-all trend, a feature that seems naturally attached to the digital domain.
So, how many cloud providers are there globally? And how many are from developing countries? There is no agreement to answer the first question. Estimates range from 500 to 2,000 providers, according to reliable sources such as Synergy Research and CRN. As I said, it is cloudy out there.
For the sake of argument, let us take 1,000 as the actual number. That implies that the long tail of the cloud power-law distribution comprises roughly 950 providers. According to Gartner, the cloud market was estimated at USD 675 billion in 2024. In that light, long-tail provider revenues could amount to 130 billion (~20%), averaging 137 million per provider. From the perspective of developing economies, that is undoubtedly a number that can attract local and regional capital into the cloud sphere. That same number might seem too small for hyperscalers and friends. In any event, intense competition among long-tail players appears to be fierce.
Another possible source of disagreement is the way the cloud market is defined. The Gartner estimate shared above includes all five segments: IaaS, PaaS, SaaS, business process as a service (BPaaS), and desktop as a service (DaaS). However, when we read in the mainstream media that Amazon has 30-plus percent of the cloud market, that figure is based only on IaaS and PaaS. In 2024, the market value of both was 352.5 billion (or 52% of the total cloud market), according to Gartner. Amazon’s 2024 10-K SEC report discloses that AWS revenues for that year totaled 107.5 billion, which is 30.5 percent of the IaaS and PaaS cloud market segments but only 16 percent of the overall cloud market.
However, if we use a different cloud market-size estimate, such as Synergy Research’s, Amazon’s share increases to 33%. The lesson here is that when it comes to cloud market shares, we should check the source of the number placed in the denominator. In any case, a market share of 30 percent or thereabouts is hardly evidence of monopoly power. In any case, the question about long-tail cloud providers across the various cloud market segments remains unanswered. Do not even bother asking about their country of origin or development levels!
Notwithstanding, we can try to move the needle a bit by looking at available cloud data. We can once again rely on datacentermap.com (DCD), which publicly shares selective cloud data. The data covers IaaS, PaaS, bare-metal, CDNs, and GPU services. It comprises 94 countries across all seven regions, including 51 developing and emerging economies, and 834 data points. Country data shows the number of unique cloud providers per country—not the actual number of deployments. DCD states that there are over 350 cloud providers, a figure that seems relatively low, according to the estimates mentioned above. In any case, we can use the data to get an initial idea of the distribution of cloud providers worldwide.
The table below, sorted by cloud providers, presents a regional overview of the data.
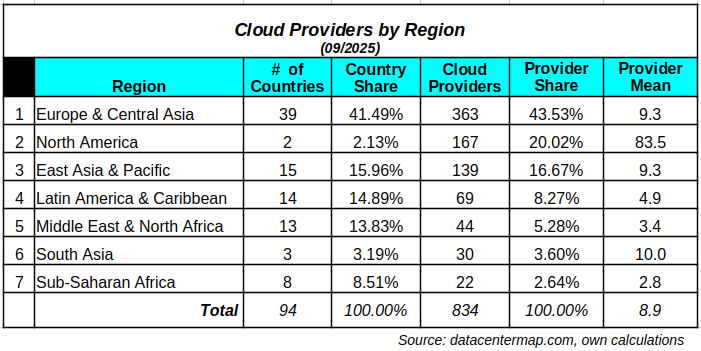
Europe and Central Asia lead the pack by a relatively large margin in all rubrics, except for the average number of cloud providers per country, where North America, comprising Canada and the U.S., is way ahead of the rest. In fact, North America has more cloud providers than LAC, MENA, South Asia, and sub-Saharan Africa combined. Perhaps not surprisingly, sub-Saharan Africa sits at the bottom of the cloud space. I should also clarify that 95 percent of the providers for the Europe and Central Asia region are, in fact, based in Europe. The contribution of the other Central Asian developing economies here is thus minimal, with Turkey leading with 11 cloud providers.
In terms of centralization, we observe a pattern similar to that of data centers, though slightly less pronounced. Indeed, 60 percent of all cloud providers operate in developed economies. If we add Australia, Japan and New Zealand from the East Asia and Pacific region, that number will increase by almost six percentage points. Note also that cloud coverage across countries is spotty in areas where developing economies constitute the majority, especially in sub-Saharan Africa, South Asia, and LAC.
In any case, DCD data seems to underestimate the number of cloud providers globally. That could certainly be the case for small cloud operators making waves in medium- and low-income regions typically ignored by the big players, who are incessantly seeking superprofits to please shareholders and Wall Street. They have no other choice! But that opens the door for regional and national capitals to enter the fray.
In the next post, I will look at country data in more detail.
Raul
