In a previous post, I pushed the idea that mining is part of the blockchain economy’s real sector. Unlike financial speculation, mining requires investment in hardware, electricity, space, human resources, etc. This also applies to small miners who will undoubtedly have to defray a lower investment amount but can join a mining pool to share mining revenues. Also, miners face intense competition, which reflects the high level of profitability in the sector.
Mining calculators seem to proliferate on the web. Such sites offer potential mining investors a rough idea of how much they can make daily and/or monthly, given the crypto’s current price being mined and the hashing the investors are willing to purchase. For example, I am told that if I buy Bitcoin mining hardware that can compute 100 tera-hashes per second, I could get a profit close to 750 dollars per month (or close to 25 dollars per day). So I could, in principle, recover my initial investment of roughly 4-5 thousand dollars in 9 months or so – assuming my pool consistently wins the proof of work race.
Mining data for both Bitcoin and Ethereum, however, does not report profits but rather revenues. The latter should cover all costs (hardware, energy, mining pool fees, depreciation, etc.) and whatever is left becomes the miners’ gross profit. Bitcoin revenues include the standards block rewards of 12.5 coins per block added plus the transaction fees. Ethereum revenues also include the rewards won from mining uncle blocks.
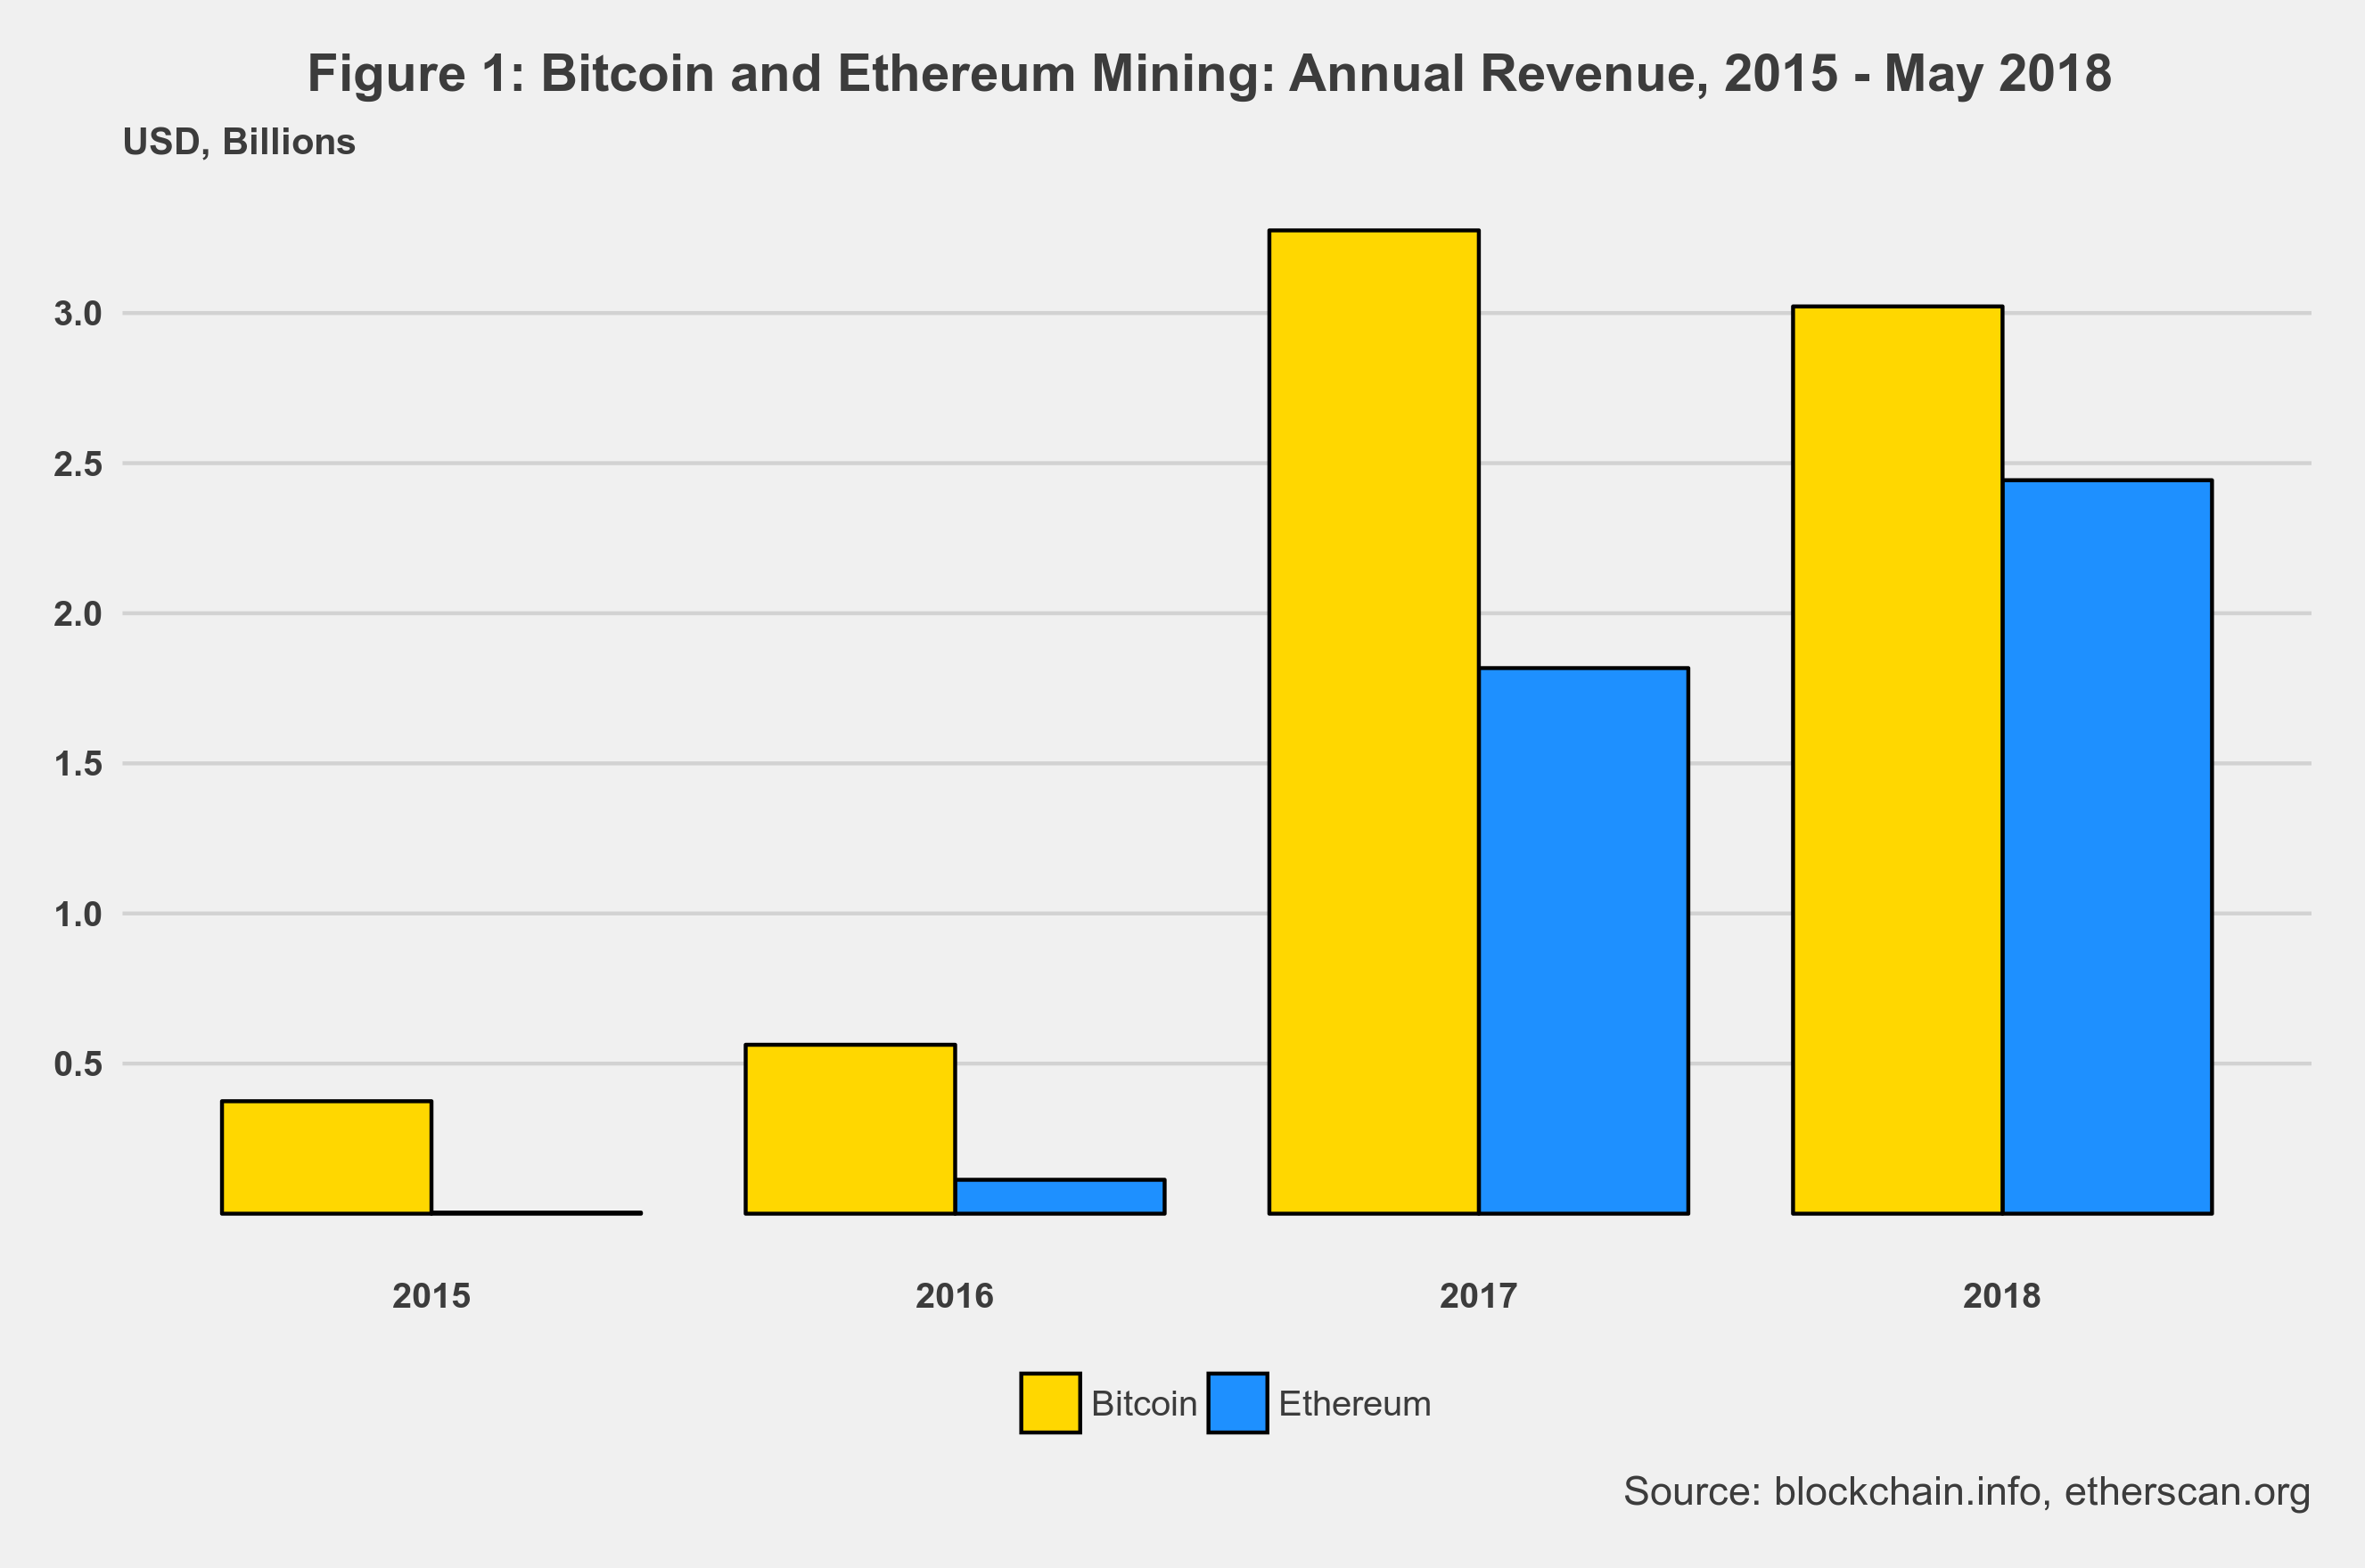
Figure1 shows total revenues per year for both Bitcoin and Ethereum.
Two key things to highlight. By the end of May of this year, mining revenues for both cryptocurrencies are outpacing by far their respective total revenues for 2017. In the case of Ethereum, mining revenues have already surpassed the total for last year. Bitcoin is not there yet, but it will be soon. Second, note that total mining revenues for Bitcoin and Ethereum seem to be converging. Ethereum mining revenues have indeed grown at a much faster pace than Bitcoin (bear in mind that Ethereum mining only started in the Summer of 2015). Total mining revenue in 2018 for both is almost 5.5 billion dollars and counting.
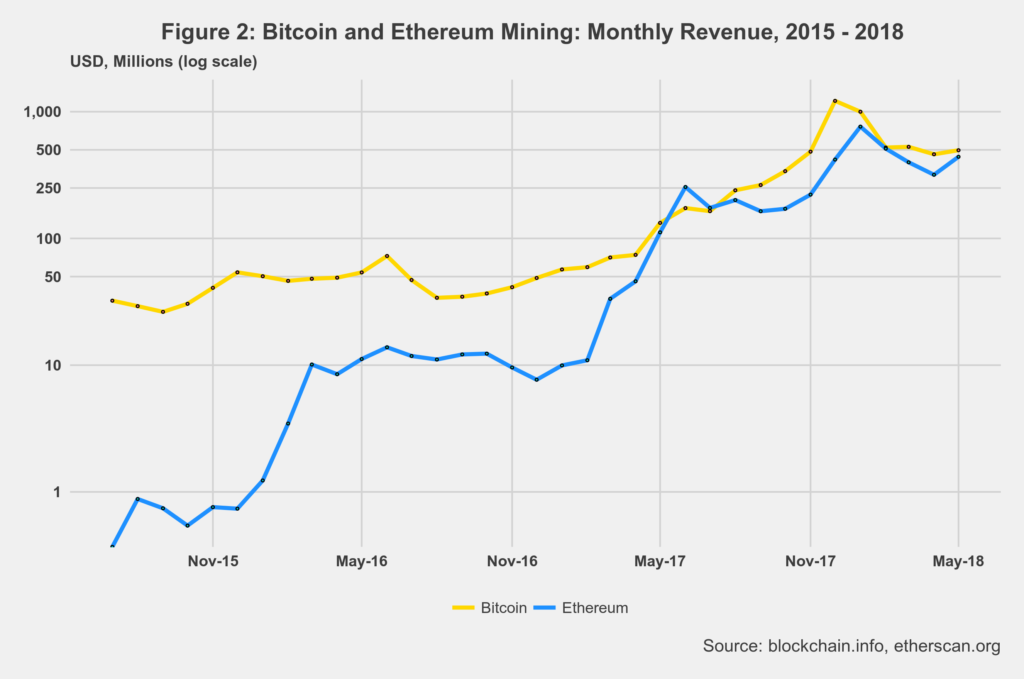
Figure 2 presents mining revenues by month. Here, the revenue convergence hypothesis is much more evident.
Furthermore, the close relationship between mining and the market price of cryptocurrencies is put into evidence as mining revenue records for both BCT and ETH occurred when their prices hit maximum value at the end of last year and the beginning of this one. Even so, mining revenues are still expected to be higher this year and hit new records. Finally, the monthly revenue chart provides more details on the rapid growth of Ethereum mining revenues.
How about revenue per hashing computing power? Bear in mind that BCT and ETH use different proof of work algorithms, which demand different types of hardware. Bitcoin is much more power (and energy) hungry than Ethereum.
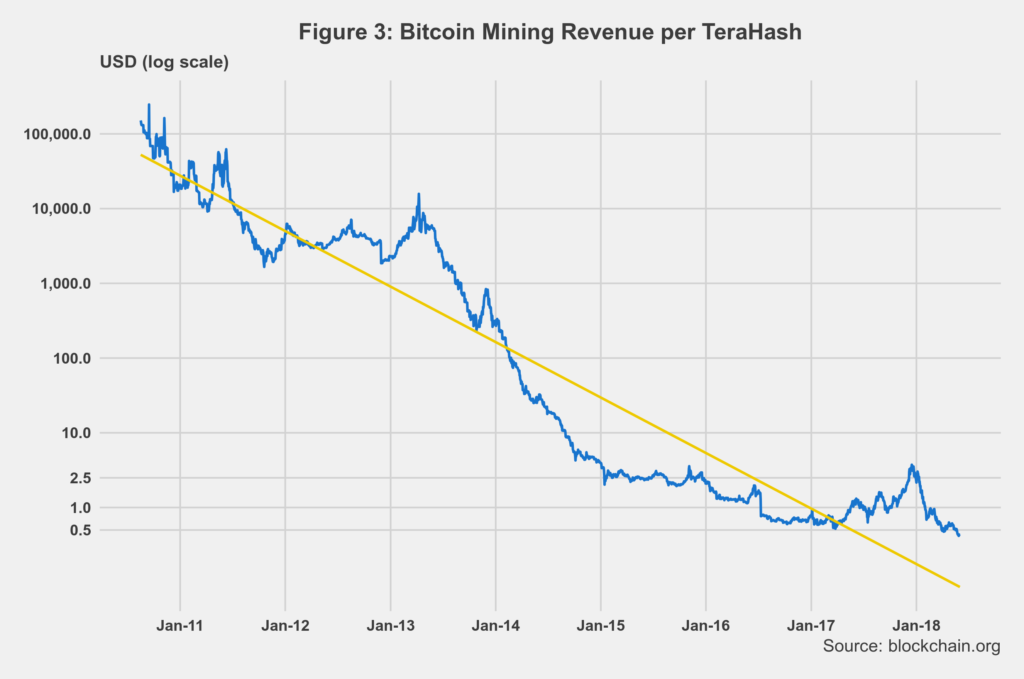
Figure 3 depicts the evolution of Bitcoin revenue per tera-hash per second.
The declining trend should not surprise as, by design, both BCT and ETH continuously increase the difficulty of finding the mining puzzle solution. Furthermore, block rewards in Bitcoin also have a declining scale. In the beginning, it was set at 50 coins per block. Today, the block reward is 12.5 coins, and by May 2010 or thereabouts, it will be 6.25 coins per block. So miners and their hardware have to do more work more for fewer coins per block. Thus, the price of Bitcoin plays a vital role here as higher prices imply a larger revenue mass, regardless of the diminishing block rewards. By the end of May, the daily revenue per one tera-hash per second was 44 cents – or 44 dollars per 100 tera-hashes/second.
Going back to the mining web calculator mentioned initially, we can now estimate the costs of mining. The mining calculator indicated that the daily profit is around 25 dollars per day for 100 tera-hashes per second. This means that total costs are 43.1 percent (44 minus 25 over 44) of the total. In such cases, mining profits are more significant than costs as they represent 56.9 percent of the total mining revenue.
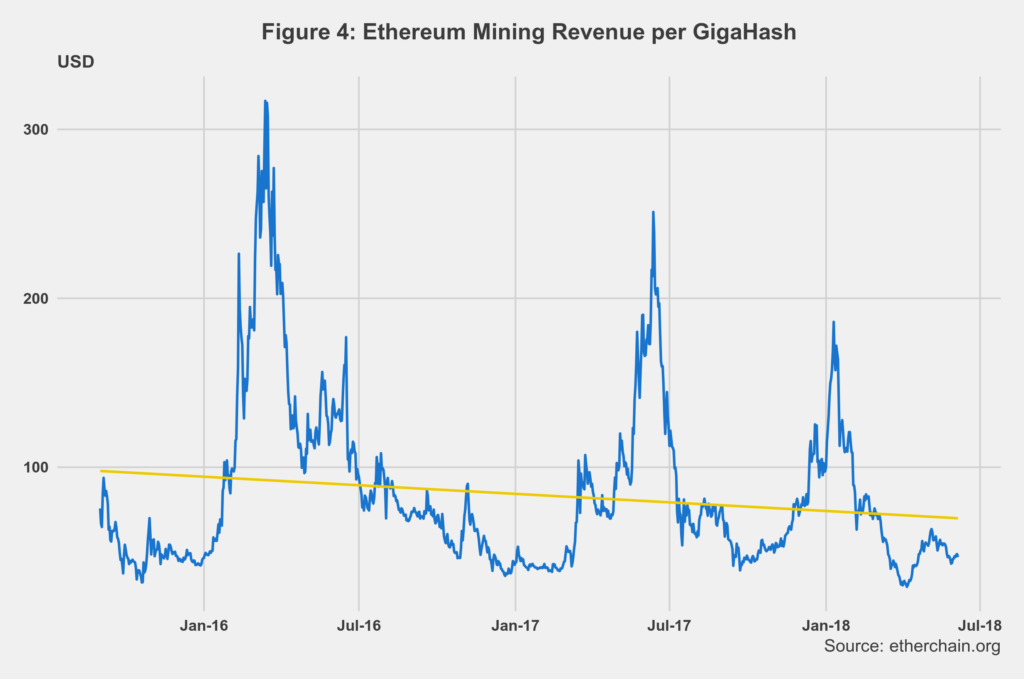
While also declining, the trend for Ethereum is slightly different, as shown in figure 4.
Ethereum depicts a more cyclical behavior. These cycles could be partially explained by the DAO failure in 2016, the reduction of the block reward from 5 to 3 Ether in 2017, and the price peak of the cryptocurrency early this year. By the end of May ETH revenue per giga-hash per second was $45.90. According to our web mining calculator, the corresponding daily profit is $28. The distribution of costs and profits in Ethereum is thus very similar to that of Bitcoin.
This makes sense is we remind ourselves of the intense competition in the blockchain mining sector. If profit differentials between the two leading cryptocurrencies were significant, then investors would migrate to the mining process where profits were higher. In a fully competitive process, profit rates tend towards equality across sectors.
Cheers, Raúl

Comments
One response to “Blockchain Mining Costs and Revenues”