I have been engaged on a short term Nigeria-based consultancy on the role ICTs1 Just in case, ICTs = Information and Communication Technologies. could play in promoting citizen engagement in public policy and decision-making processes – or what some call e-participation.
Part of the job requires research on the rate of ICT diffusion in the country at the state level as the project being designed will operate at the subnational level. For our purposes, ICTs include both Internet and mobile phone, and the use of social media platforms by local stakeholders. The usual expectation is that the highest levels of poverty and overall socioeconomic inequality are accompanied by lower ICT diffusion rates.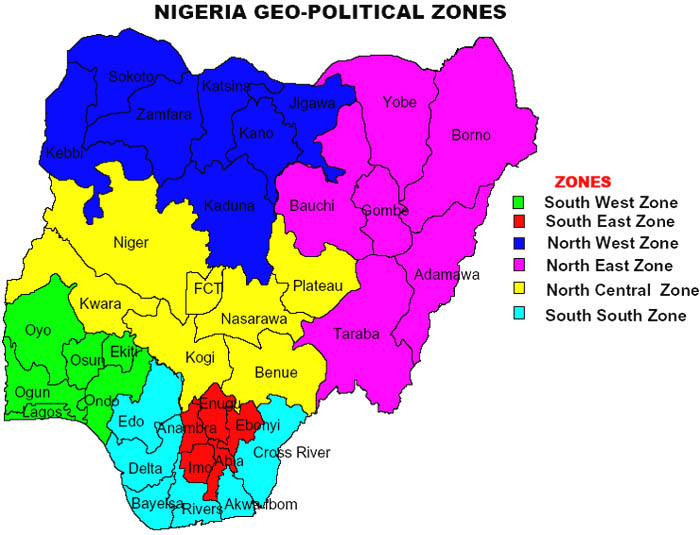
Getting data for national ICT diffusion is relatively easy as they are in fact multiple sources. One of them tells us that for Internet access, Nigeria is ranked 7th with over 85 million users. Incidentally, Nigeria is also ranked 7th globally when it comes to total population.2 Over 170 million in 2013 according to the Economist World in Figures app. The flip side of the high global Internet ranking is that Nigeria is ranked 6th for people not connected to the Internet, with India and China leading here.
This last stat is just an indicator of the internal diffusion of the Internet in the country is below 50%. Here, Nigeria is ranked 106th in the world with similar numbers to Mexico, but it is 2nd for countries in Sub-Saharan Africa, just behind South Africa and a notch ahead of Kenya. The story for mobile subscribers is similar.
But what about stats for the 36 states3 12 of these states were created in 1991. in Nigeria? Fortunately, Nigeria’s National Bureau of Statistics (NBS) published a report earlier this year with both Internet and Mobile stats by the state for the 1st quarter of 2016.4 The NBS site reports that this document has been downloaded 1,144 times to date, a low number that raises issues about its proper diffusion within the country. The data in the report has been furnished by mobile providers and ISPs. However, the report is in PDF format which makes data manipulation difficult. I could transfer two of the three tables I needed into a spreadsheet but population data had to be re-entered by hand to generate the charts below. Open Data anyone?. For the record, NBS got into trouble in 2011 when it published a national household ICT survey saying that Internet diffusion was just over 3% 5 Historical data shows that in 2011, Internet penetration in the country was only over 28%. However, it is essential to clarify that the aim of the 2011 report was to measure household access to the Internet. The number of household members that access the Internet from home -and not the total number of Internet users.6 Data for South Africa, for example, indicates that there is a massive gap between household access and overall Internet access. See: http://bit.ly/2dHZGmh. The difference between the two suggests that most people that use the Internet must leave home to do so.
Let us now get to the actual data (finally!).
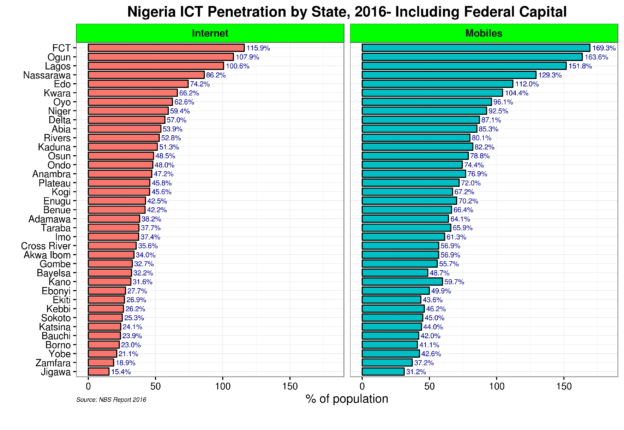
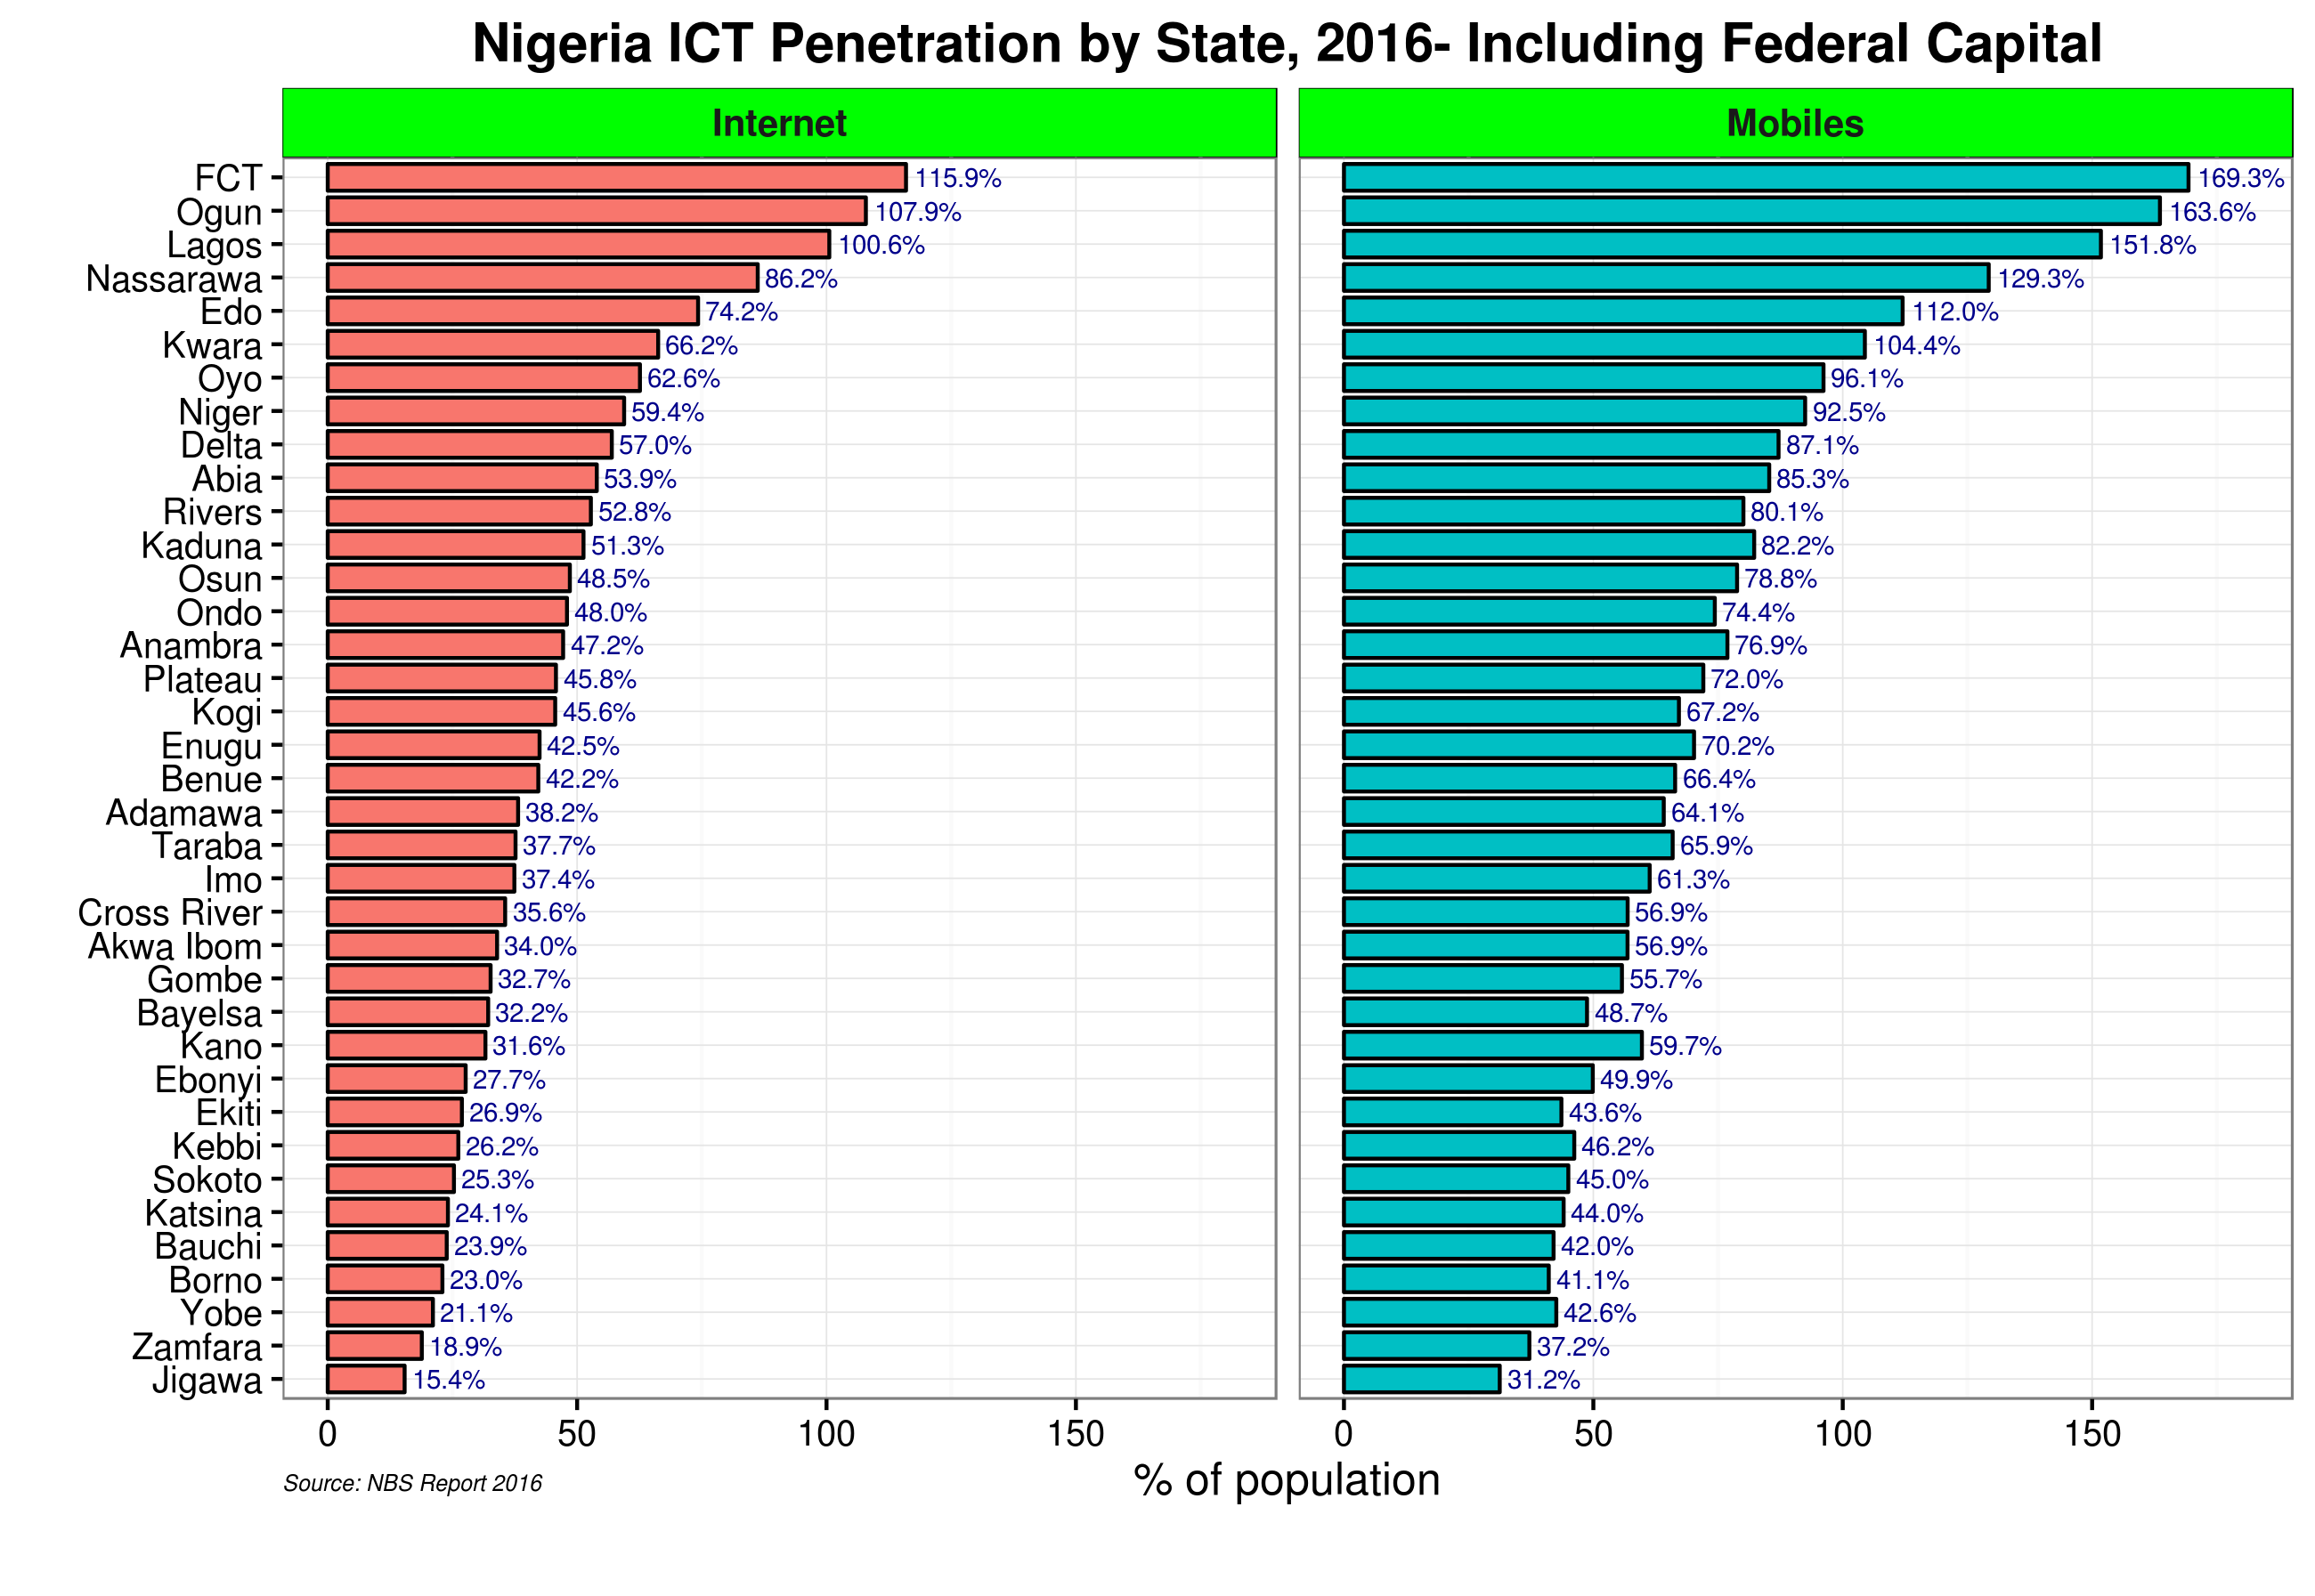 The graph above presents data by state for both Internet and Mobiles, ranked by the former in descending order. It also includes the Federal Capital Territory (FCT) which in fact has the highest diffusion in both categories.7 Diffusion rates over 100% show that users have multiple connections and/or multiple cell phones/SIM cards. Note that the data for mobile phones describes the number of subscribers and not number of users. One user can have multiple subscriptions with different providers for example. A diffusion rate of 100% or more does not mean that every single person in the state of territory in question is connected. Here are some key patterns:
- Overall access by state shows great dispersion for both Internet and mobile subscribers. For every Internet subscriber in Jigawa, the state with the lowest score, there are 7 in FCT and over 6 in Ogun and Lagos. For mobiles, the dispersion is less as the ratio is approximately 1 to 5 between bottom and top-ranked.
- 22 states (or 61%, excluding FCT) have Internet diffusion rates below the national average of 47.6%. The same goes for mobile subscribers who have a national average of 76.2%.
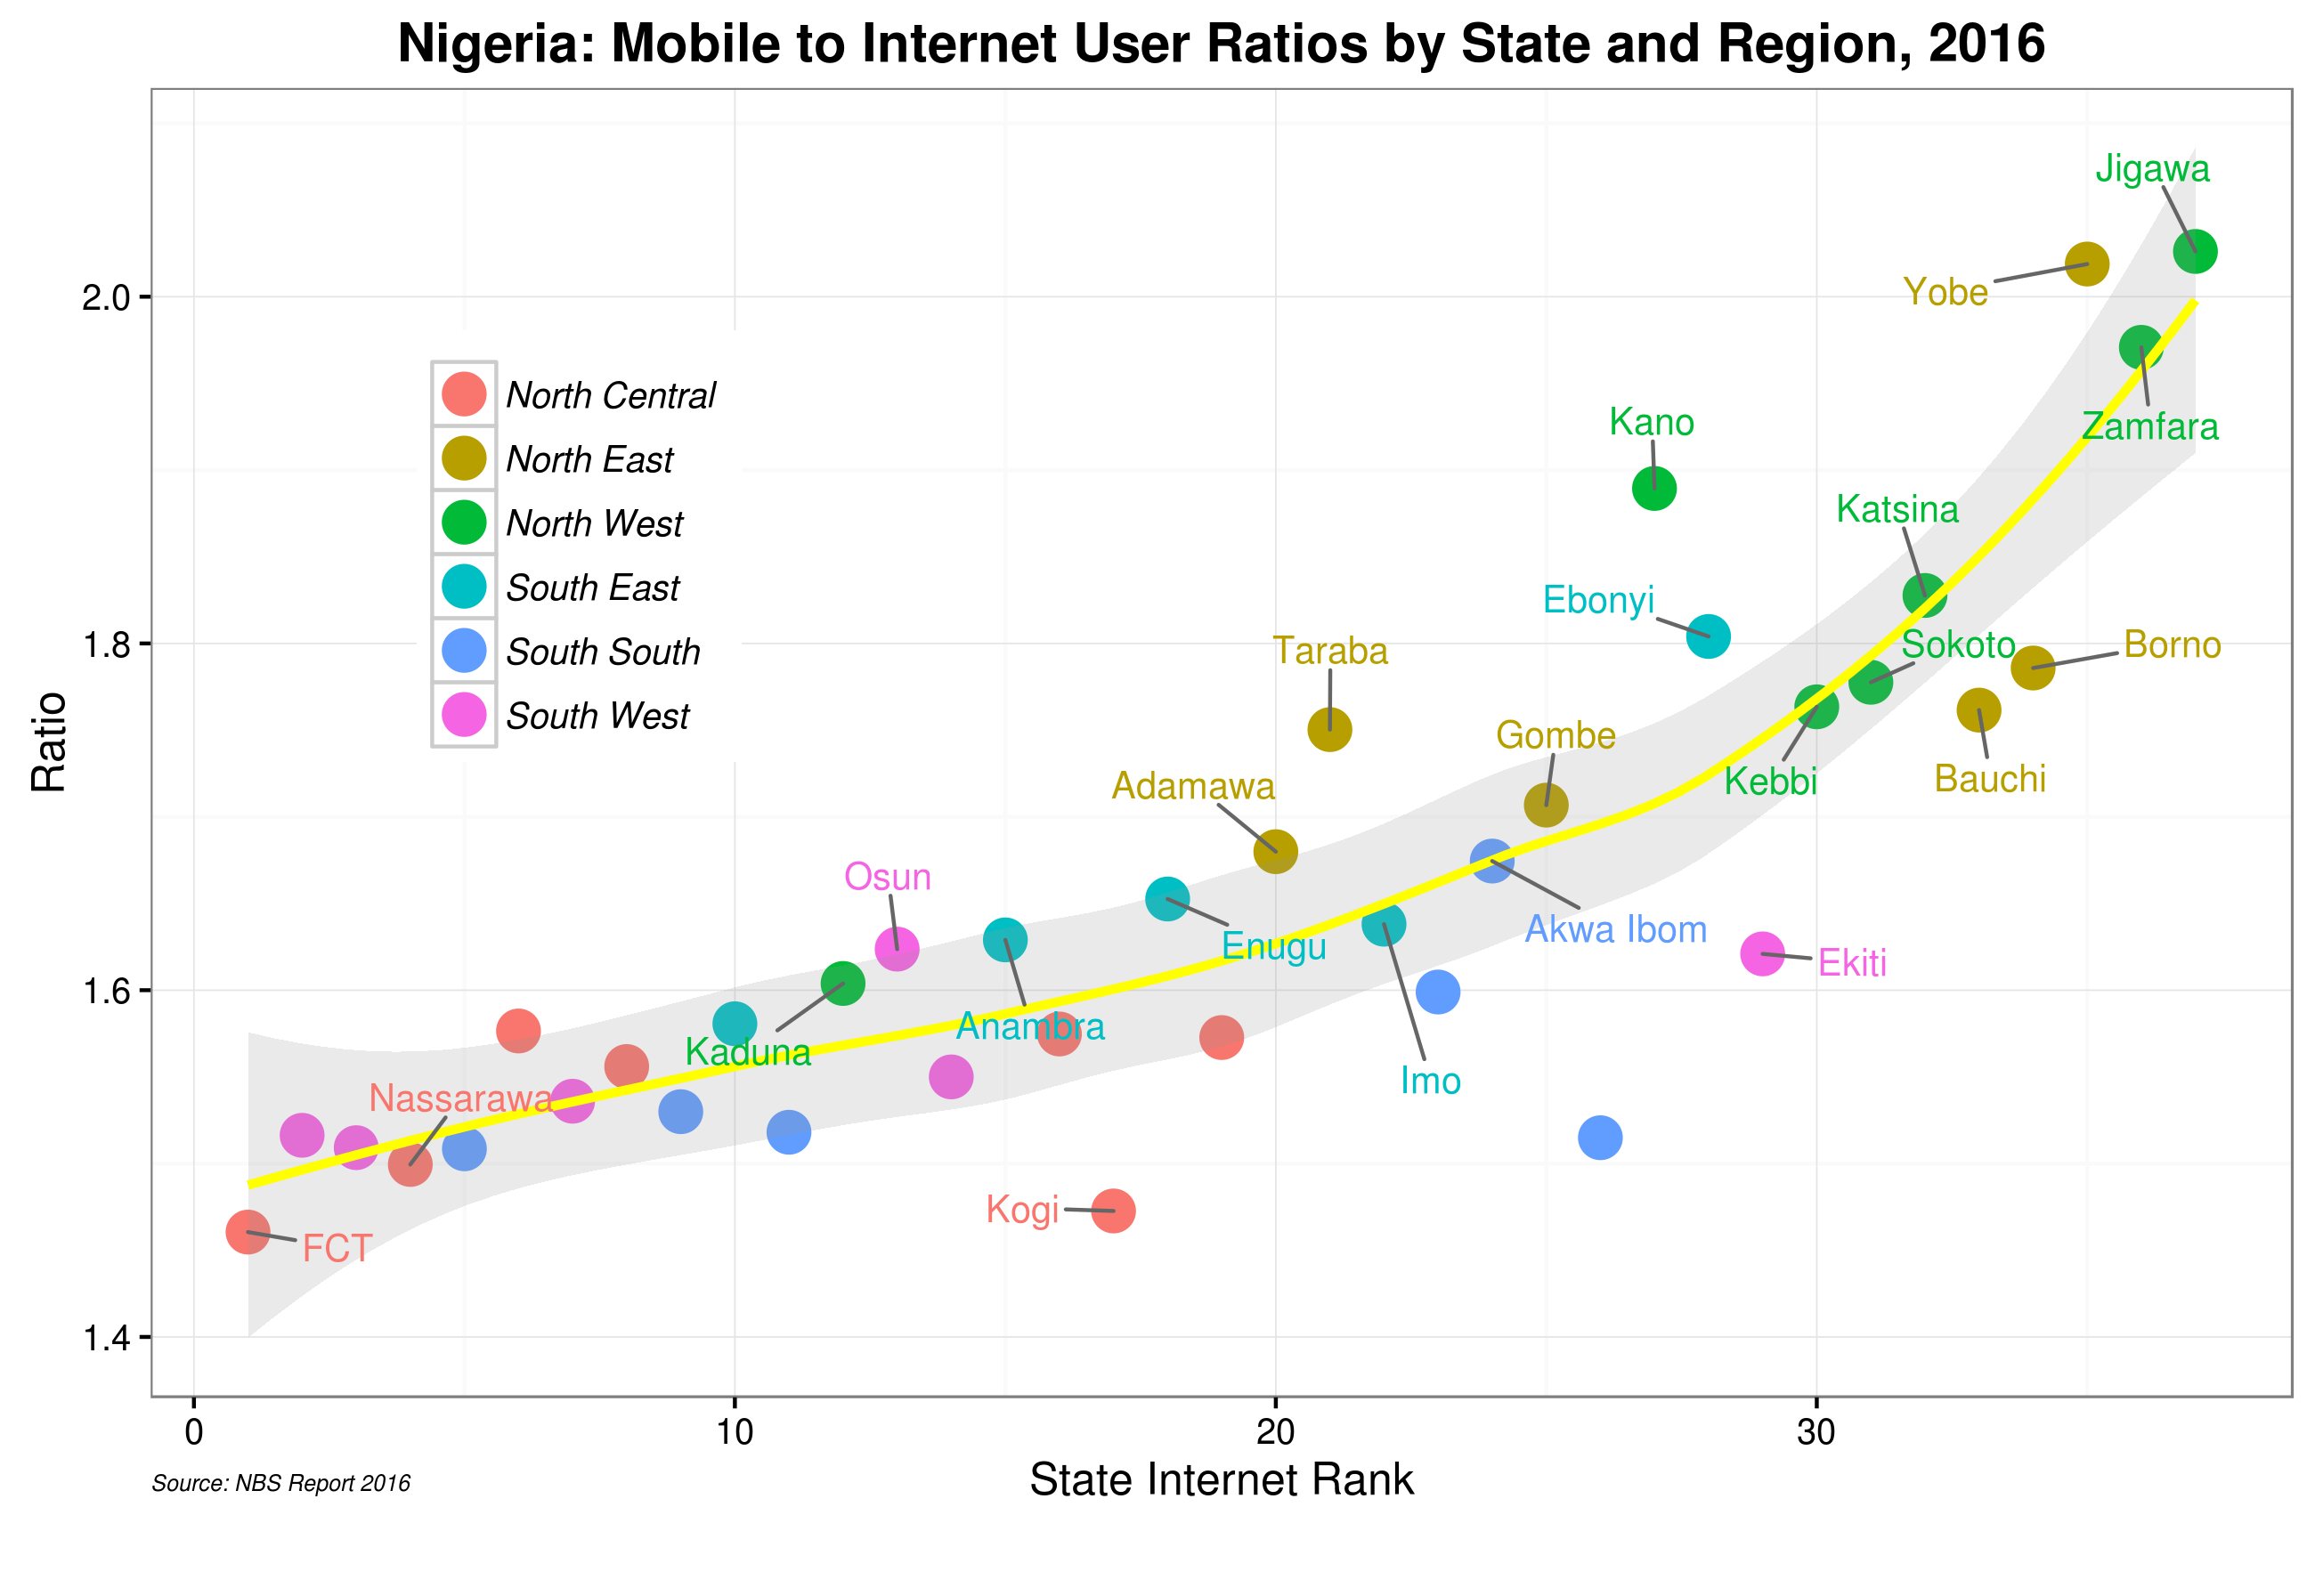
- The average ratio of mobile to Internet subscribers is 1.6. However, this ratio increases in states with lower Internet diffusion scores. For example, Jigawa has 2 mobile subscribers for every Internet user while in FCT the ratio is 1.4. This is a significant trend that policymakers and donors should factor in when designing ICT programmes that intend to promote human development. This trend is shown in the graph below:
- There is a high correlation between poverty and ICT diffusion as most of the 15 states at the bottom of the list have poverty rates above 70%.8 See http://bit.ly/2ednQIf. Literacy rates also are low in these states.
What about the geographical distribution of ICT diffusion in the country? The graph below presents data aggregated by the 6 geopolitical regions.9 The map at the top of this blog shows these regions. The NBS data does not include regional information, so I added that to the data set.
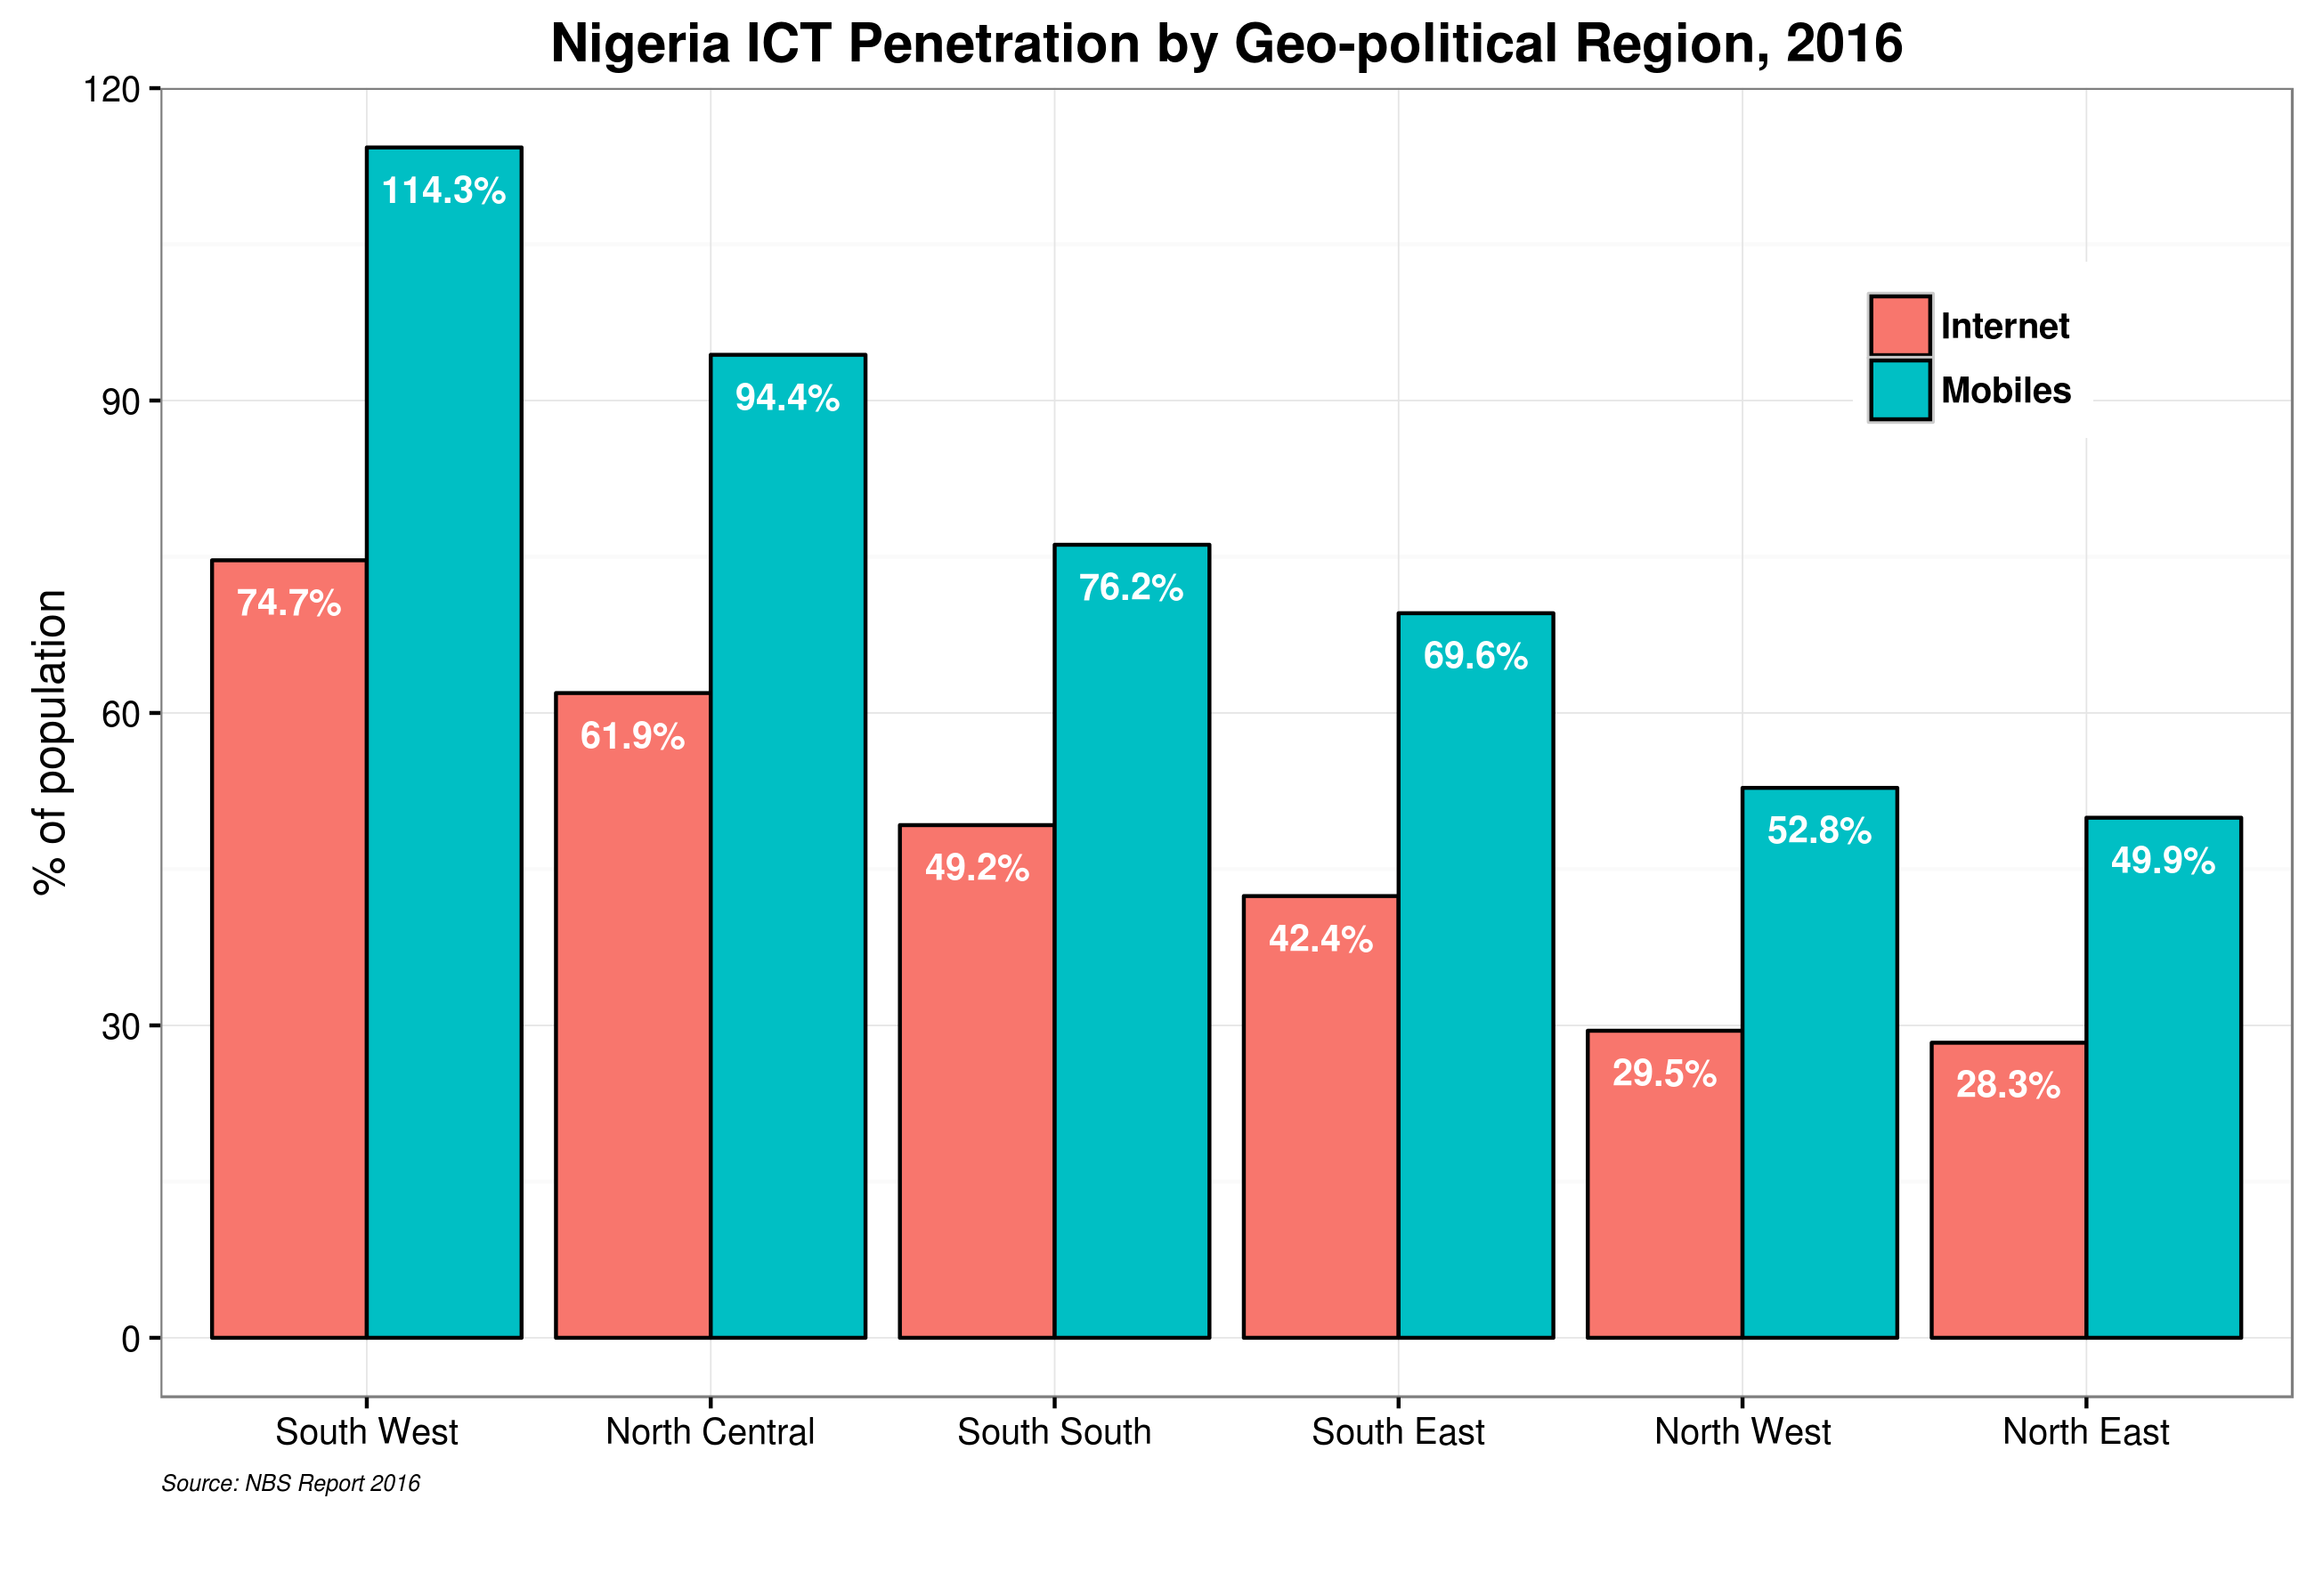 There is a clear North-South divide for both Internet and mobile diffusion. Both North West and North East zones sit at the bottom of the rankings whereas South West, propelled by both Lagos and Ogun, and North Central, where FCT is located, are well ahead of the rest. And once again, Internet access gaps across zones are more significant than those for mobiles.
All in all, this brief analysis shows the status of ICT diffusion in the country. While progress can indeed be accounted for, unequal diffusion across states and regions seems to be the core pattern. This is especially important for projects and programmes that are planning to work at the subregional or state level. A one size fits all approach will certainly not be the best way forward.
Cheers, Raúl

Related Content:


Endnotes
| ⇧1 | Just in case, ICTs = Information and Communication Technologies. |
|---|---|
| ⇧2 | Over 170 million in 2013 according to the Economist World in Figures app. |
| ⇧3 | 12 of these states were created in 1991. |
| ⇧4 | The NBS site reports that this document has been downloaded 1,144 times to date, a low number that raises issues about its proper diffusion within the country. The data in the report has been furnished by mobile providers and ISPs. However, the report is in PDF format which makes data manipulation difficult. I could transfer two of the three tables I needed into a spreadsheet but population data had to be re-entered by hand to generate the charts below. Open Data anyone?. |
| ⇧5 | Historical data shows that in 2011, Internet penetration in the country was only over 28%. |
| ⇧6 | Data for South Africa, for example, indicates that there is a massive gap between household access and overall Internet access. See: http://bit.ly/2dHZGmh. The difference between the two suggests that most people that use the Internet must leave home to do so. |
| ⇧7 | Diffusion rates over 100% show that users have multiple connections and/or multiple cell phones/SIM cards. Note that the data for mobile phones describes the number of subscribers and not number of users. One user can have multiple subscriptions with different providers for example. A diffusion rate of 100% or more does not mean that every single person in the state of territory in question is connected. |
| ⇧8 | See http://bit.ly/2ednQIf. Literacy rates also are low in these states. |
| ⇧9 | The map at the top of this blog shows these regions. The NBS data does not include regional information, so I added that to the data set. |