In a previous post, I explored the relationship between C02 emissions, country income levels and population looking at production data only. Here, emissions are assigned to the country where goods or services are produced or generated, disregarding final consumption. In a globalized economy, however, we should expect that many products are indeed consumed far away from their home countries. Migration is the normal state of affairs. For example, steel produced in China, Japan or India, the top three world leaders, might travel to the U.S or the E.U for final consumption. CO2 emissions generated by such steel consumption should thus be allocated to the countries importing steel – and not to the steel producers.
Note that in our example the U.S. and the E.U can, in turn, export products that generate CO2 emissions to other countries. What counts in the end is the net balance between exports and imports. In this fashion, consumption-based emissions (C) are defined as the total territorial or production emissions (T) minus the sum of exports(E) and imports(I) or
C = T – (E + I)
Transfers are defined as the difference between exports and imports. If imports are larger than exports, then consumption-based emissions will be larger than territorial (C > T) and transfers are negative. On the other hand, if a country exports more than what it imports, its CO2 emissions will be lower (C < T), transfers being on the plus side in this case.
Consumption-based emissions were only recently developed and data only starts in 1990 and runs until 2016, one year behind production data. Note also that the data only covers just over 130 countries, few less than production data. Like territorial emissions, they make extensive use of input-output matrices that are commonly used for national account systems. Consumption-based emissions interrelated global and domestic supply chains to yield its estimates. Source data is extracted from the Global Trade Analysis Project, GTAP.
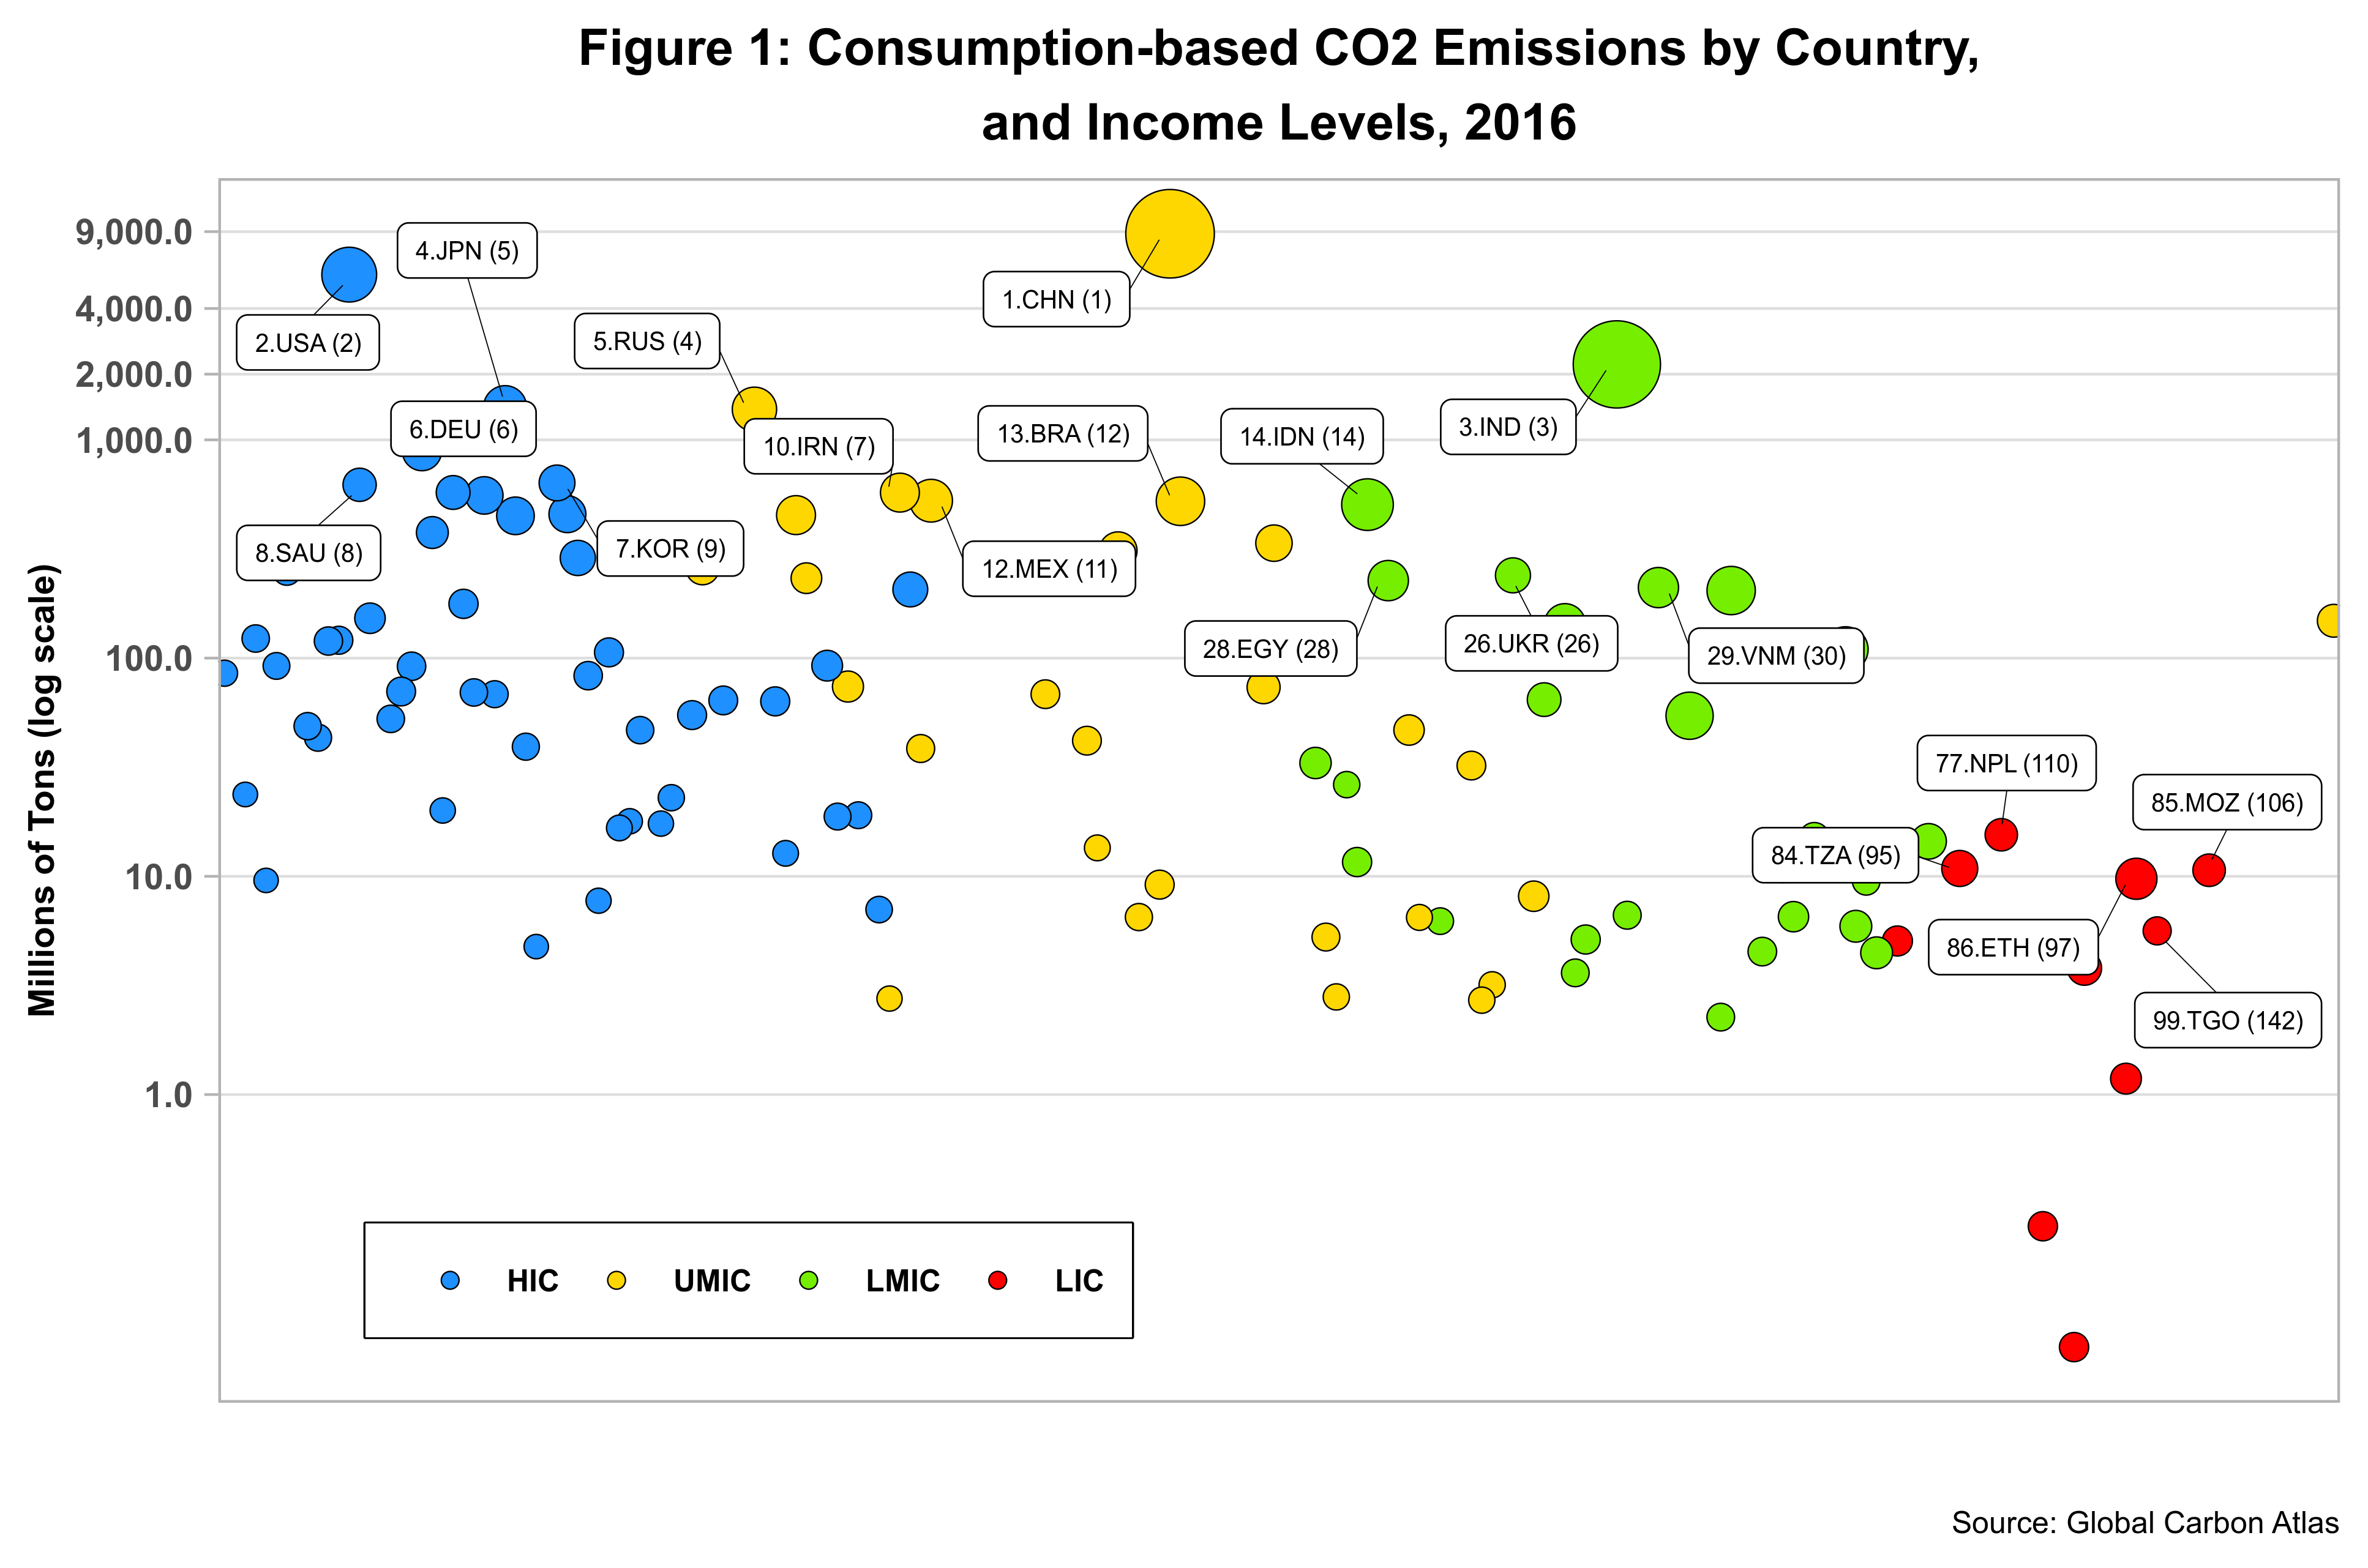
So what difference does it make for the analysis? Let us start by looking at consumption-based emissions by country income levels shown in Figure 1 below.
 The graph displays the top five countries for each of the four income levels. Each of then has two associated numbers which represent rankings. The number in parenthesis informs us about the country’s territorial ranking. The number to the left of the country code is the overall consumption-based emissions ranking. For example, Japan is ranked 4th in consumption-based rankings but is in position five in terms of production rankings. In other words, Japan is importing more emission-based products than it is exporting. Other country rankings remain very much the same with the apparent exception of low-income countries. However, changes in top rankings are due to the lack of data for countries that report the highest production-based CO2 emissions. Transfers thus seem to be unnoticeable at this level.
But they are real, as shown in Figure 2. The chart excludes China simply because the country accounts for almost sixty percent of all transfers and is thus an outlier.
![]() Countries above the zero line are net exporters, while those below are net importers. Most countries included in the data hover around the zero-line, but a few seem to run either up or down, fast too. At the bottom, only a sea full of blue countries shows up. At the other extreme, very few are present and none of them if from the low-income team. The trend is thus clear. Most high-income countries see their CO2 emissions go up thanks to imports from UMICs and LMICs. Figure 3 below highlights the outliers at both ends.
Countries above the zero line are net exporters, while those below are net importers. Most countries included in the data hover around the zero-line, but a few seem to run either up or down, fast too. At the bottom, only a sea full of blue countries shows up. At the other extreme, very few are present and none of them if from the low-income team. The trend is thus clear. Most high-income countries see their CO2 emissions go up thanks to imports from UMICs and LMICs. Figure 3 below highlights the outliers at both ends.
![]() China, Russia, Indonesia, South Africa and Iran are the leading exporters and account for 99.9 percent of all outgoing transfers. By the same token, the U.S., Japan, Great Britain, France, Italy and Germany represent almost 50 percent of all imports, the U.S. having the larger share of all with over 400 million tons – or 20% of all imports. Nearly 15 percent of China’s territorial emissions are transferred to industrialized countries via the exports of products and services that are consumed in those countries. At the aggregate level, transfers were just under seven percent of CO2 emissions in 2016.
China, Russia, Indonesia, South Africa and Iran are the leading exporters and account for 99.9 percent of all outgoing transfers. By the same token, the U.S., Japan, Great Britain, France, Italy and Germany represent almost 50 percent of all imports, the U.S. having the larger share of all with over 400 million tons – or 20% of all imports. Nearly 15 percent of China’s territorial emissions are transferred to industrialized countries via the exports of products and services that are consumed in those countries. At the aggregate level, transfers were just under seven percent of CO2 emissions in 2016.
In the end, we note that a few countries are responsible for the bulk of emissions transfers. And this is why we could not see their impact when we looked at consumption-based data at the country level.
Cheers, Raúl
Revised 2019-12-21


